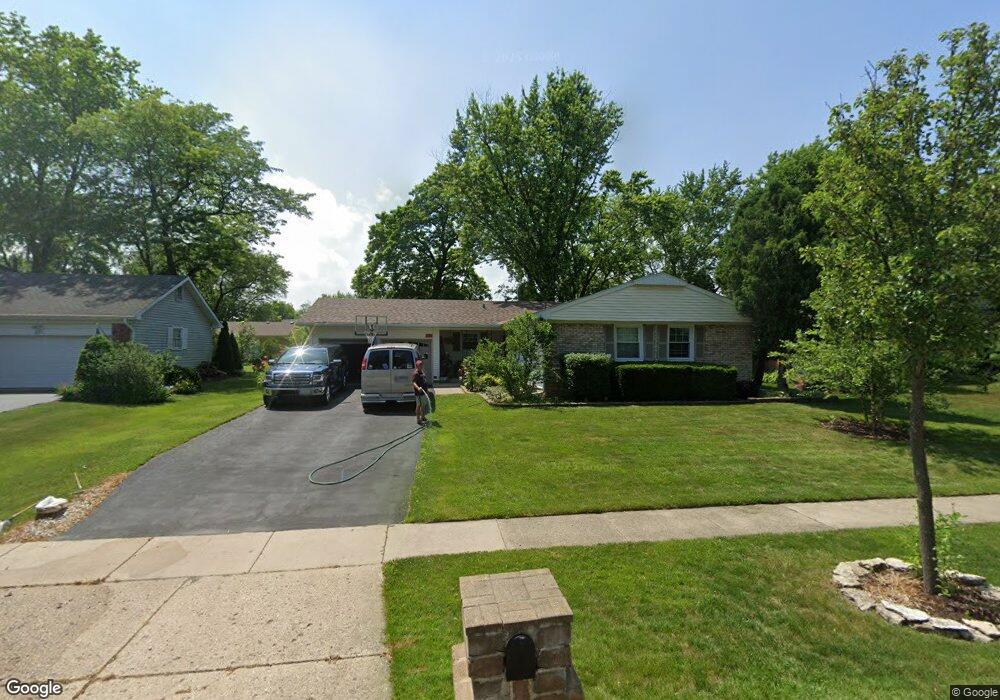
911 Indian Spring Ln Buffalo Grove, IL 60089
Estimated Value: $425,000 - $518,000
--
Bed
2
Baths
1,614
Sq Ft
$285/Sq Ft
Est. Value
About This Home
This home is located at 911 Indian Spring Ln, Buffalo Grove, IL 60089 and is currently estimated at $460,769, approximately $285 per square foot. 911 Indian Spring Ln is a home located in Lake County with nearby schools including Ivy Hall Elementary School, Twin Groves Middle School, and Adlai E Stevenson High School.
Ownership History
Date
Name
Owned For
Owner Type
Purchase Details
Closed on
Oct 16, 2002
Sold by
Kempf Karl F and Kempf Mary Lynn
Bought by
Kempf Karl F and Kempf Mary Lynn
Current Estimated Value
Home Financials for this Owner
Home Financials are based on the most recent Mortgage that was taken out on this home.
Original Mortgage
$175,000
Outstanding Balance
$70,950
Interest Rate
5.71%
Estimated Equity
$389,819
Purchase Details
Closed on
Sep 30, 1994
Sold by
Dvorak Todd A and Dvorak Aubrey Michael
Bought by
Kempf Karl F and Kempf Mary Lynn
Home Financials for this Owner
Home Financials are based on the most recent Mortgage that was taken out on this home.
Original Mortgage
$122,000
Interest Rate
8.55%
Create a Home Valuation Report for This Property
The Home Valuation Report is an in-depth analysis detailing your home's value as well as a comparison with similar homes in the area
Home Values in the Area
Average Home Value in this Area
Purchase History
| Date | Buyer | Sale Price | Title Company |
|---|---|---|---|
| Kempf Karl F | -- | -- | |
| Kempf Karl F | $169,000 | Ticor Title Insurance Compan |
Source: Public Records
Mortgage History
| Date | Status | Borrower | Loan Amount |
|---|---|---|---|
| Open | Kempf Karl F | $175,000 | |
| Closed | Kempf Karl F | $122,000 |
Source: Public Records
Tax History Compared to Growth
Tax History
| Year | Tax Paid | Tax Assessment Tax Assessment Total Assessment is a certain percentage of the fair market value that is determined by local assessors to be the total taxable value of land and additions on the property. | Land | Improvement |
|---|---|---|---|---|
| 2024 | $11,644 | $128,784 | $36,132 | $92,652 |
| 2023 | $11,061 | $121,517 | $34,093 | $87,424 |
| 2022 | $11,061 | $112,078 | $31,445 | $80,633 |
| 2021 | $10,641 | $110,870 | $31,106 | $79,764 |
| 2020 | $10,390 | $111,248 | $31,212 | $80,036 |
| 2019 | $10,249 | $110,838 | $31,097 | $79,741 |
| 2018 | $9,599 | $107,350 | $30,733 | $76,617 |
| 2017 | $9,416 | $104,845 | $30,016 | $74,829 |
| 2016 | $9,166 | $100,398 | $28,743 | $71,655 |
| 2015 | $8,915 | $93,891 | $26,880 | $67,011 |
| 2014 | $8,253 | $86,184 | $28,870 | $57,314 |
| 2012 | $8,176 | $86,357 | $28,928 | $57,429 |
Source: Public Records
Map
Nearby Homes
- 950 Belmar Ln
- 800 Clohesey Dr
- 12 Cloverdale Ct
- 931 Shady Grove Ln
- 1141 Devonshire Rd
- 1152 Courtland Dr Unit 406
- 1032 Courtland Dr Unit 9
- 887 Saybrook Ln Unit 2
- 1325 Fairfax Ln
- 610 Checker Dr
- 1265 Devonshire Rd
- 1324 Fairfax Ln Unit B32
- 711 Woodhollow Ln
- 5107 N Arlington Heights Rd
- 890 Knollwood Dr
- 390 Springside Ln
- 1118 Larraway Dr
- 327 Lasalle Ln
- 1357 Bristol Ln Unit Q4
- 1514 Sumter Dr
- 891 Indian Spring Ln
- 921 Indian Spring Ln
- 993 Alden Ln
- 1005 Alden Ln
- 981 Alden Ln
- 931 Indian Spring Ln
- 910 Indian Spring Ln
- 1011 Alden Ln
- 890 Indian Spring Ln
- 920 Indian Spring Ln
- 969 Alden Ln Unit 12
- 880 Indian Spring Ln
- 941 Indian Spring Ln
- 871 Indian Spring Ln
- 930 Indian Spring Ln
- 1015 Alden Ln
- 957 Alden Ln
- 870 Indian Spring Ln
- 940 Indian Spring Ln
- 994 Alden Ln