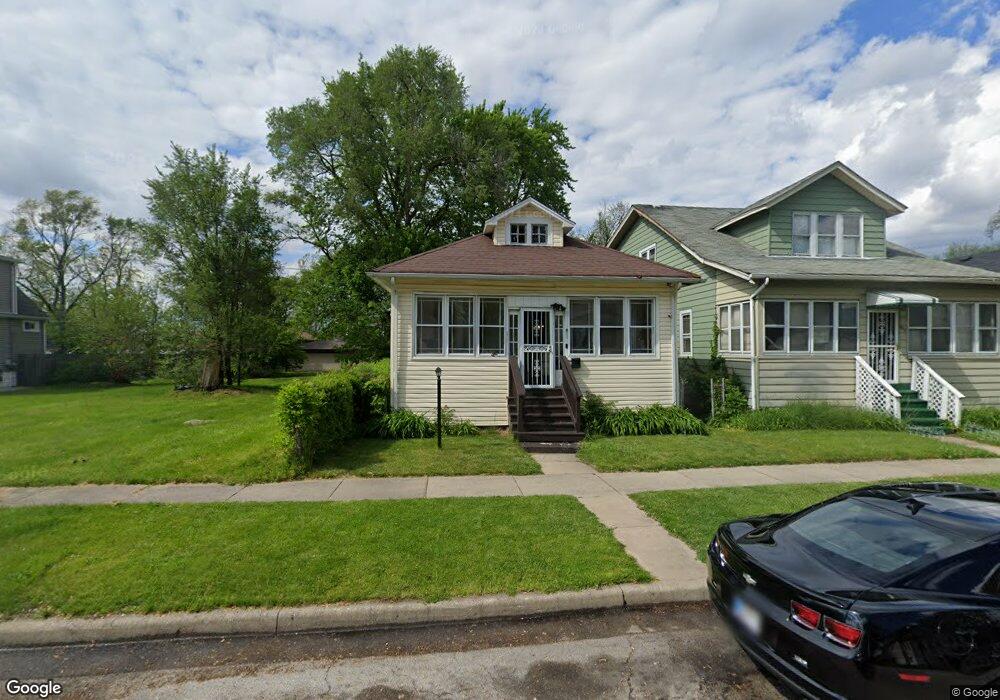
911 Morris St Hammond, IN 46320
Estimated Value: $156,000 - $183,000
3
Beds
2
Baths
2,184
Sq Ft
$77/Sq Ft
Est. Value
About This Home
This home is located at 911 Morris St, Hammond, IN 46320 and is currently estimated at $167,902, approximately $76 per square foot. 911 Morris St is a home located in Lake County with nearby schools including Maywood Elementary School, Eggers Middle School, and Hammond High School.
Ownership History
Date
Name
Owned For
Owner Type
Purchase Details
Closed on
May 16, 2019
Sold by
Gaddy Latonya
Bought by
Gaddy Latonya and Gaddy Rodney
Current Estimated Value
Purchase Details
Closed on
Sep 26, 2017
Sold by
Allen Elaine
Bought by
Allen Elaine and Gaddy Latonya
Purchase Details
Closed on
Sep 7, 2017
Sold by
Allen Elaine and Harwell Leo
Bought by
Allen Elaine
Purchase Details
Closed on
Mar 21, 2017
Sold by
Allen Elaine
Bought by
Harwell Leo and Allen Ellaine
Purchase Details
Closed on
Feb 16, 2017
Sold by
Harwell Leo
Bought by
Allen Elainc
Create a Home Valuation Report for This Property
The Home Valuation Report is an in-depth analysis detailing your home's value as well as a comparison with similar homes in the area
Home Values in the Area
Average Home Value in this Area
Purchase History
| Date | Buyer | Sale Price | Title Company |
|---|---|---|---|
| Gaddy Latonya | -- | None Available | |
| Allen Elaine | -- | None Available | |
| Allen Elaine | -- | None Available | |
| Harwell Leo | -- | None Available | |
| Allen Elainc | -- | None Available |
Source: Public Records
Tax History
| Year | Tax Paid | Tax Assessment Tax Assessment Total Assessment is a certain percentage of the fair market value that is determined by local assessors to be the total taxable value of land and additions on the property. | Land | Improvement |
|---|---|---|---|---|
| 2025 | $1,301 | $127,300 | $17,100 | $110,200 |
| 2024 | $4,761 | $114,300 | $17,100 | $97,200 |
| 2023 | $1,152 | $99,600 | $18,600 | $81,000 |
| 2022 | $1,152 | $93,700 | $18,600 | $75,100 |
| 2021 | $852 | $71,900 | $6,200 | $65,700 |
| 2020 | $1,662 | $60,900 | $6,200 | $54,700 |
| 2019 | $242 | $54,800 | $6,200 | $48,600 |
| 2018 | $113 | $52,500 | $6,200 | $46,300 |
| 2017 | $108 | $51,600 | $6,200 | $45,400 |
| 2016 | $567 | $44,000 | $6,200 | $37,800 |
| 2014 | $506 | $45,000 | $6,200 | $38,800 |
| 2013 | $472 | $43,200 | $6,200 | $37,000 |
Source: Public Records
Map
Nearby Homes
- 920 Highland St
- 924 Highland St
- 1128 Highland St
- 1137 Lyons St
- 830 Becker St
- 911 Conkey St
- 909 Conkey St
- 1016 Ames St
- 5901 Columbia Ave
- 5856 Wallace Rd
- 1007 Moss St
- 6244 Madison Ave
- 1019 Cleveland St
- 6130 Van Buren Ave Unit 32
- 5631 Alice St
- 1360 Sherman St
- 922 Summer St
- 1127 164th Place
- 1119 Sibley St
- 5632 Claude Ave
Your Personal Tour Guide
Ask me questions while you tour the home.