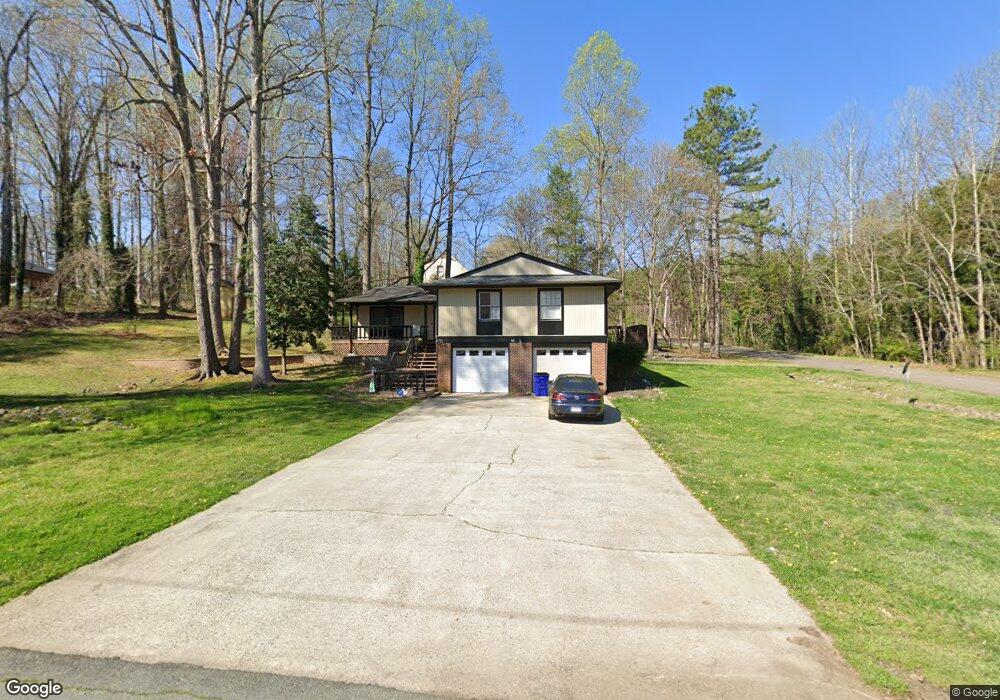
911 N Garden Ave Siler City, NC 27344
Estimated Value: $268,000 - $300,000
3
Beds
2
Baths
1,757
Sq Ft
$163/Sq Ft
Est. Value
About This Home
This home is located at 911 N Garden Ave, Siler City, NC 27344 and is currently estimated at $286,471, approximately $163 per square foot. 911 N Garden Ave is a home located in Chatham County with nearby schools including Siler City Elementary School, Chatham Middle, and Jordan Matthews High.
Ownership History
Date
Name
Owned For
Owner Type
Purchase Details
Closed on
Aug 2, 2022
Sold by
Patricia Lopez I Iris
Bought by
Lopez Iris Patricia
Current Estimated Value
Home Financials for this Owner
Home Financials are based on the most recent Mortgage that was taken out on this home.
Original Mortgage
$126,000
Outstanding Balance
$114,128
Interest Rate
5.3%
Mortgage Type
New Conventional
Estimated Equity
$172,343
Purchase Details
Closed on
Mar 9, 2017
Sold by
Moreno Nemesio and Moreno Magdalena
Bought by
Lopez Iris Patricia and Borrayo Jorge I
Home Financials for this Owner
Home Financials are based on the most recent Mortgage that was taken out on this home.
Original Mortgage
$121,550
Interest Rate
4.25%
Mortgage Type
New Conventional
Purchase Details
Closed on
May 12, 2000
Sold by
Roscoe Jr William Don
Bought by
Moreno Nemesio and Moreno Magdal Ena
Create a Home Valuation Report for This Property
The Home Valuation Report is an in-depth analysis detailing your home's value as well as a comparison with similar homes in the area
Home Values in the Area
Average Home Value in this Area
Purchase History
| Date | Buyer | Sale Price | Title Company |
|---|---|---|---|
| Lopez Iris Patricia | -- | Riggsbee Chad Wesley | |
| Lopez Iris Patricia | -- | None Listed On Document | |
| Lopez Iris Patricia | $120,000 | Attorney | |
| Moreno Nemesio | $122,000 | -- |
Source: Public Records
Mortgage History
| Date | Status | Borrower | Loan Amount |
|---|---|---|---|
| Open | Lopez Iris Patricia | $126,000 | |
| Closed | Lopez Iris Patricia | $126,000 | |
| Previous Owner | Lopez Iris Patricia | $121,550 |
Source: Public Records
Tax History Compared to Growth
Tax History
| Year | Tax Paid | Tax Assessment Tax Assessment Total Assessment is a certain percentage of the fair market value that is determined by local assessors to be the total taxable value of land and additions on the property. | Land | Improvement |
|---|---|---|---|---|
| 2025 | $3,262 | $263,704 | $36,720 | $226,984 |
| 2024 | $3,262 | $182,129 | $30,600 | $151,529 |
| 2023 | $2,304 | $182,129 | $30,600 | $151,529 |
| 2022 | $2,195 | $182,129 | $30,600 | $151,529 |
| 2021 | $2,195 | $182,129 | $30,600 | $151,529 |
| 2020 | $1,749 | $144,578 | $24,500 | $120,078 |
| 2019 | $1,749 | $144,578 | $24,500 | $120,078 |
| 2018 | $1,645 | $144,578 | $24,500 | $120,078 |
| 2017 | $1,645 | $144,578 | $24,500 | $120,078 |
| 2016 | $1,560 | $140,081 | $25,000 | $115,081 |
| 2015 | $1,544 | $139,052 | $25,000 | $114,052 |
| 2014 | $1,532 | $139,052 | $25,000 | $114,052 |
| 2013 | -- | $139,052 | $25,000 | $114,052 |
Source: Public Records
Map
Nearby Homes
- 806 Cliftwood Dr
- 1004 Candlewood Cir
- 1007 Driftwood Dr
- 1501 Duet Dr
- 803 Woodland Dr
- 1707 N Chatham Ave
- Tbd W 3rd St
- 0 W 3rd St
- 1306 Sunset Dr
- 519 W Raleigh St
- 409 E 10th St
- 303 W Dolphin St
- 2200 W 3rd St
- 2248 W 3rd St
- 513 W Glendale St
- 128 Olde Manor Ct
- TBD E 3rd St
- 0 Airport Rd Unit 10131777
- 00 U S Highway 64
- 17880 U S Highway 64
- 803 Tanglewood Dr
- 800 Driftwood Dr
- 910 N Garden Ave
- 805 Tanglewood Dr
- 915 N Garden Ave
- 914 N Garden Ave
- 909 Garden Ave
- 909 N Garden Ave
- 419 W 10th St
- 503 W 10th St
- 807 Tanglewood Dr
- 908 N Garden Ave
- 808 Driftwood Dr
- 0 W 10th St Unit 2496936
- 0 W 10th St Unit 2363811
- Lot 12 W 10th St
- TBD W 10th St
- 907 N Garden Ave
- 444 W 9th St
- 444 W 9th St Unit 444/442