911 N Moran Rd Trivoli, IL 61569
Estimated Value: $172,000 - $178,000
2
Beds
2
Baths
1,166
Sq Ft
$150/Sq Ft
Est. Value
About This Home
This home is located at 911 N Moran Rd, Trivoli, IL 61569 and is currently estimated at $175,000, approximately $150 per square foot. 911 N Moran Rd is a home located in Peoria County with nearby schools including Farmington Central Elementary School, Farmington Central Junior High School, and Farmington Central High School.
Ownership History
Date
Name
Owned For
Owner Type
Purchase Details
Closed on
Jun 5, 2017
Sold by
Craig Thompson and Craig Ilean
Bought by
Jones Monica and Jones Chase E
Current Estimated Value
Create a Home Valuation Report for This Property
The Home Valuation Report is an in-depth analysis detailing your home's value as well as a comparison with similar homes in the area
Home Values in the Area
Average Home Value in this Area
Purchase History
| Date | Buyer | Sale Price | Title Company |
|---|---|---|---|
| Jones Monica | -- | -- |
Source: Public Records
Tax History Compared to Growth
Tax History
| Year | Tax Paid | Tax Assessment Tax Assessment Total Assessment is a certain percentage of the fair market value that is determined by local assessors to be the total taxable value of land and additions on the property. | Land | Improvement |
|---|---|---|---|---|
| 2024 | $3,020 | $57,390 | $9,570 | $47,820 |
| 2023 | $3,457 | $52,170 | $8,700 | $43,470 |
| 2022 | $3,455 | $51,810 | $7,930 | $43,880 |
| 2021 | $3,380 | $50,300 | $7,700 | $42,600 |
| 2020 | $3,340 | $49,800 | $7,620 | $42,180 |
| 2019 | $3,549 | $50,310 | $7,700 | $42,610 |
| 2018 | $3,543 | $50,810 | $7,770 | $43,040 |
| 2017 | $3,574 | $50,810 | $7,770 | $43,040 |
| 2016 | $3,422 | $49,820 | $7,620 | $42,200 |
| 2015 | $3,356 | $48,370 | $7,400 | $40,970 |
| 2014 | $3,379 | $48,130 | $7,360 | $40,770 |
| 2013 | -- | $48,370 | $7,400 | $40,970 |
Source: Public Records
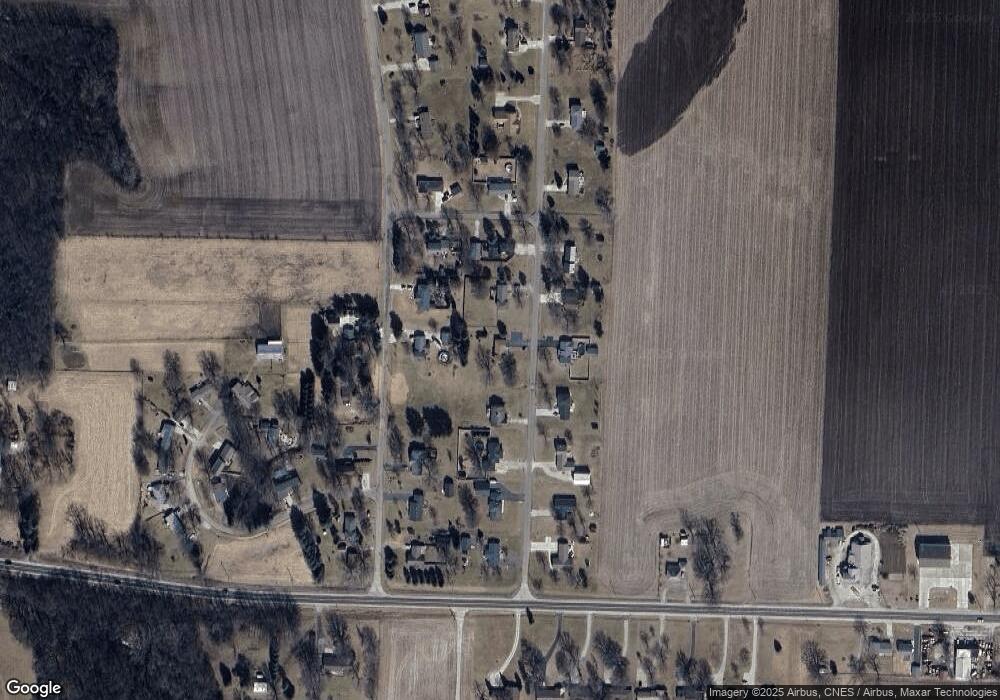
Map
Nearby Homes
- 111 N Depot St
- 18519 W Main St
- 17308 W Cottonwood Rd
- 000 W Bartholomew Ln
- 19421 W Bartholomew Ln
- 0 W Cottonwood Rd
- 14425 W Sommerfield Rd
- 23677 E Park Rd
- 626 N Pekin Ln
- 518 N Pekin Ln
- 12903 W Center St
- 700 N Elbert Ct
- 308 E Prairie St
- 186 N Cone St
- 121 E Court St
- 117 E Vernon St
- 416 N Runkle St
- 665 S Main St
- Lot 38 N Phil Gould Dr
- Lot 37 N Phil Gould Dr
- 927 N Moran Rd
- 901 N Moran Rd
- 928 N Quarry Rd
- 912 N Moran Rd
- 912 N Quarry Rd
- 928 N Moran Rd
- 902 N Moran Rd
- 1009 N Moran Rd
- 805 N Moran Rd
- 19222 W Bethel Rd
- 806 N Quarry Rd
- 806 N Moran Rd
- 1010 N Moran Rd
- 925 N Quarry Rd
- 1015 N Quarry Rd
- 919 N Quarry Rd
- 729 N Moran Rd
- 19301 W Linwood Dr
- 730 N Quarry Rd
- 19207 W Bethel Rd