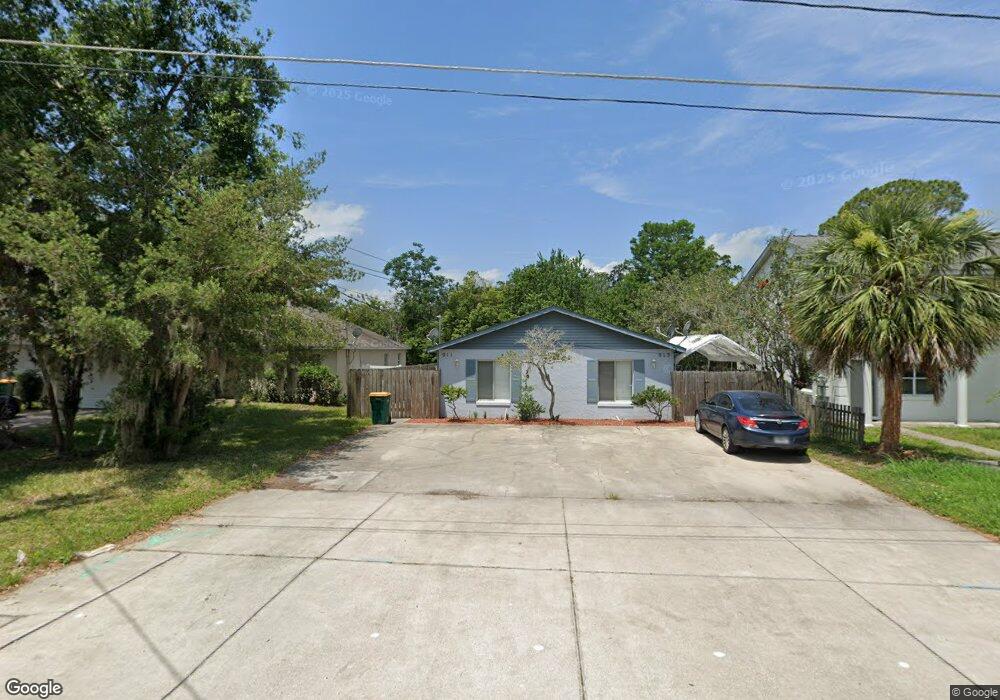
911 N Rockingham Ave Unit 913 Tavares, FL 32778
Estimated Value: $297,236 - $466,000
4
Beds
2
Baths
1,900
Sq Ft
$212/Sq Ft
Est. Value
About This Home
This home is located at 911 N Rockingham Ave Unit 913, Tavares, FL 32778 and is currently estimated at $402,809, approximately $212 per square foot. 911 N Rockingham Ave Unit 913 is a home located in Lake County with nearby schools including Tavares Elementary School, Tavares Middle School, and Tavares High School.
Ownership History
Date
Name
Owned For
Owner Type
Purchase Details
Closed on
Feb 27, 2020
Sold by
Kellerman Kenneth
Bought by
Frye Jonathan and Frye Kaely
Current Estimated Value
Purchase Details
Closed on
Feb 27, 2017
Sold by
Hope Jeanne and Hope Jeanne
Bought by
Kellerman Kenneth
Purchase Details
Closed on
Feb 1, 2017
Bought by
Kellerman Kenneth
Purchase Details
Closed on
Jan 29, 2014
Sold by
Mad Hatter Investments Llc
Bought by
Hope Jeanne and Jeanne Hope Trust
Purchase Details
Closed on
Aug 13, 2013
Sold by
Howison Laura L and Krygier Brad
Bought by
Mad Hatter Investments Llc
Purchase Details
Closed on
Mar 8, 1996
Sold by
Reynolds William F
Bought by
Krygier Joyce E
Home Financials for this Owner
Home Financials are based on the most recent Mortgage that was taken out on this home.
Original Mortgage
$52,000
Interest Rate
7.03%
Create a Home Valuation Report for This Property
The Home Valuation Report is an in-depth analysis detailing your home's value as well as a comparison with similar homes in the area
Home Values in the Area
Average Home Value in this Area
Purchase History
| Date | Buyer | Sale Price | Title Company |
|---|---|---|---|
| Frye Jonathan | $217,500 | A & B T&E Svcs Llc | |
| Kellerman Kenneth | -- | None Available | |
| Kellerman Kenneth | $100 | -- | |
| Hope Jeanne | $132,500 | Attorney | |
| Mad Hatter Investments Llc | $52,000 | Attorney | |
| Krygier Joyce E | $65,000 | -- |
Source: Public Records
Mortgage History
| Date | Status | Borrower | Loan Amount |
|---|---|---|---|
| Previous Owner | Krygier Joyce E | $52,000 | |
| Closed | Mad Hatter Investments Llc | $0 |
Source: Public Records
Tax History Compared to Growth
Tax History
| Year | Tax Paid | Tax Assessment Tax Assessment Total Assessment is a certain percentage of the fair market value that is determined by local assessors to be the total taxable value of land and additions on the property. | Land | Improvement |
|---|---|---|---|---|
| 2025 | $4,427 | $258,176 | $36,243 | $221,933 |
| 2024 | $4,427 | $258,176 | $36,243 | $221,933 |
| 2023 | $4,427 | $250,898 | $36,243 | $214,655 |
| 2022 | $4,188 | $236,401 | $21,746 | $214,655 |
| 2021 | $3,603 | $182,560 | $0 | $0 |
| 2020 | $2,194 | $104,859 | $0 | $0 |
| 2019 | $2,236 | $104,859 | $0 | $0 |
| 2018 | $2,224 | $104,859 | $0 | $0 |
| 2017 | $2,008 | $95,482 | $0 | $0 |
| 2016 | $1,854 | $85,754 | $0 | $0 |
| 2015 | $1,828 | $84,208 | $0 | $0 |
| 2014 | $1,820 | $82,802 | $0 | $0 |
Source: Public Records
Map
Nearby Homes
- 1002 N New Hampshire Ave
- 0 N New Hampshire Ave
- 1026 Capella Dr
- 1127 Belmont Cir
- 1025 Capella Dr
- 1237 Elkhart Cir
- 1353 Windsor St
- 1129 Elkhart Cir
- 1019 S Capella Dr
- 208 Palm Way
- 1115 Elkhart Cir
- 1116 Elkhart Cir
- 1113 Elkhart Cir
- 0 W Burleigh Blvd Unit MFRG5088917
- 1332 Nassau Cir
- 1105 Nassau Cir
- 1440 Nassau Cir
- 1207 Apache Cir
- 1503 Canal Ct
- 1317 Mohawk Cir
- 911 N Rockingham Ave
- 911-913 N Rockingham Ave
- 913 N Rockingham Ave
- 915 N Rockingham Ave Unit 917
- 909 N Rockingham Ave
- 907 N Rockingham Ave
- 916 N New Hampshire Ave
- 922 N New Hampshire Ave
- 905 N Rockingham Ave
- 904 N New Hampshire Ave
- 1001 & 1005 N Rockingham Ave
- 121 E Clifford St
- 914 N Rockingham Ave
- 910 N Rockingham Ave
- 912 N Rockingham Ave
- 918 N Rockingham Ave
- 908 N Rockingham Ave
- 910 N Rockingham Ave