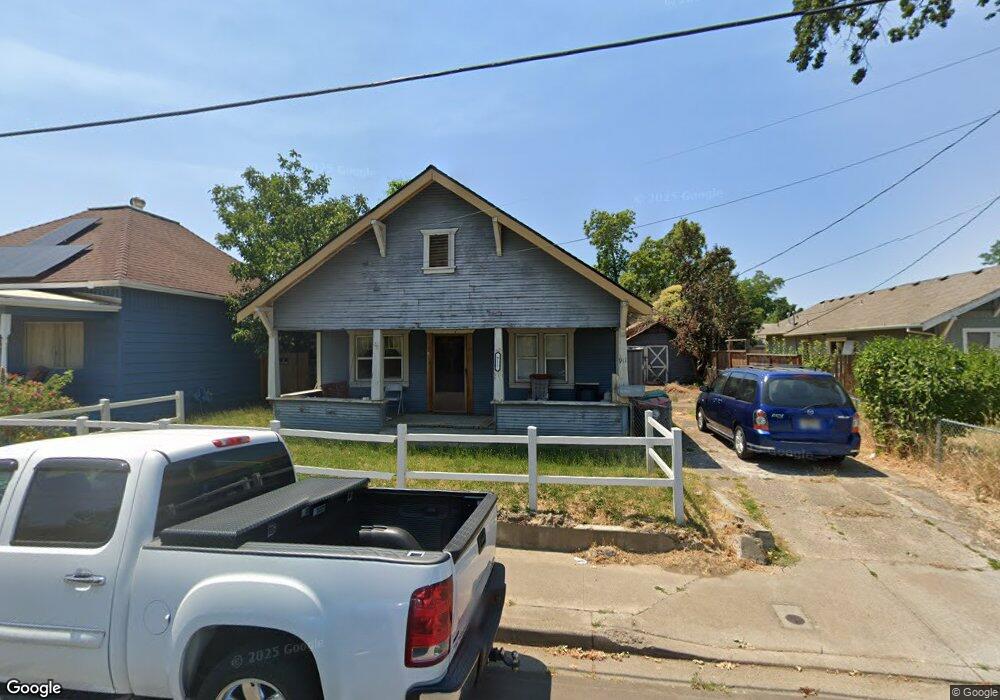
911 Narregan St Medford, OR 97501
Liberty Park NeighborhoodEstimated Value: $219,000 - $272,000
3
Beds
1
Bath
1,000
Sq Ft
$245/Sq Ft
Est. Value
About This Home
This home is located at 911 Narregan St, Medford, OR 97501 and is currently estimated at $245,205, approximately $245 per square foot. 911 Narregan St is a home located in Jackson County with nearby schools including Jackson Elementary School, McLoughlin Middle School, and North Medford High School.
Ownership History
Date
Name
Owned For
Owner Type
Purchase Details
Closed on
Jun 29, 2000
Sold by
Harrison Joseph Douglas and Harrison Ernestina G
Bought by
Cullop Clarence R and Cullop Susan E
Current Estimated Value
Home Financials for this Owner
Home Financials are based on the most recent Mortgage that was taken out on this home.
Original Mortgage
$69,700
Outstanding Balance
$28,474
Interest Rate
10.25%
Estimated Equity
$216,731
Create a Home Valuation Report for This Property
The Home Valuation Report is an in-depth analysis detailing your home's value as well as a comparison with similar homes in the area
Home Values in the Area
Average Home Value in this Area
Purchase History
| Date | Buyer | Sale Price | Title Company |
|---|---|---|---|
| Cullop Clarence R | $82,000 | Crater Title Insurance |
Source: Public Records
Mortgage History
| Date | Status | Borrower | Loan Amount |
|---|---|---|---|
| Open | Cullop Clarence R | $69,700 | |
| Closed | Cullop Clarence R | $12,300 |
Source: Public Records
Tax History Compared to Growth
Tax History
| Year | Tax Paid | Tax Assessment Tax Assessment Total Assessment is a certain percentage of the fair market value that is determined by local assessors to be the total taxable value of land and additions on the property. | Land | Improvement |
|---|---|---|---|---|
| 2025 | $1,210 | $114,970 | $50,000 | $64,970 |
| 2024 | $1,210 | $111,630 | $48,550 | $63,080 |
| 2023 | $1,294 | $108,380 | $47,140 | $61,240 |
| 2022 | $1,144 | $108,380 | $47,140 | $61,240 |
| 2021 | $1,115 | $105,230 | $45,770 | $59,460 |
| 2020 | $1,091 | $102,170 | $44,440 | $57,730 |
| 2019 | $1,065 | $96,320 | $41,900 | $54,420 |
| 2018 | $1,038 | $93,520 | $40,690 | $52,830 |
| 2017 | $1,020 | $93,520 | $40,690 | $52,830 |
| 2016 | $1,026 | $88,160 | $38,360 | $49,800 |
| 2015 | $987 | $88,160 | $38,360 | $49,800 |
| 2014 | $969 | $83,110 | $36,160 | $46,950 |
Source: Public Records
Map
Nearby Homes
- 341 Haven St
- 815 Niantic St
- 512 N Holly St
- 1021 Niantic St
- 1129 Pinecroft Ave
- 441 N Grape St
- 440 N Grape St
- 607 W 2nd St
- 427 N Grape St
- 1116 Niantic St
- 552 Haven St
- 214 N Peach St
- 814 W 2nd St
- 824 N Riverside Ave
- 425 N Columbus Ave
- 854 W 2nd St
- 325 W 4th St
- 60 N Peach St
- 722 Dahl Place Unit 17
- 410 Kenwood Ave
- 909 Narregan St
- 917 Narregan St
- 905 1/2 Narregan St
- 203 W Clark St
- 211 W Clark St
- 907 Narregan St Unit Lot1
- 907 Narregan St
- 217 W Clark St
- 905 Narregan St Unit Lot3
- 905 Narregan St Unit Lot2
- 905 Narregan St
- 219 W Clark St
- 901 Narregan St
- 912 Narregan St
- 0 Narregan St
- 301 W Clark St
- 900 Narregan St
- 903 1/2 Narregan St
- 119 W Clark St
- 819 Narregan St