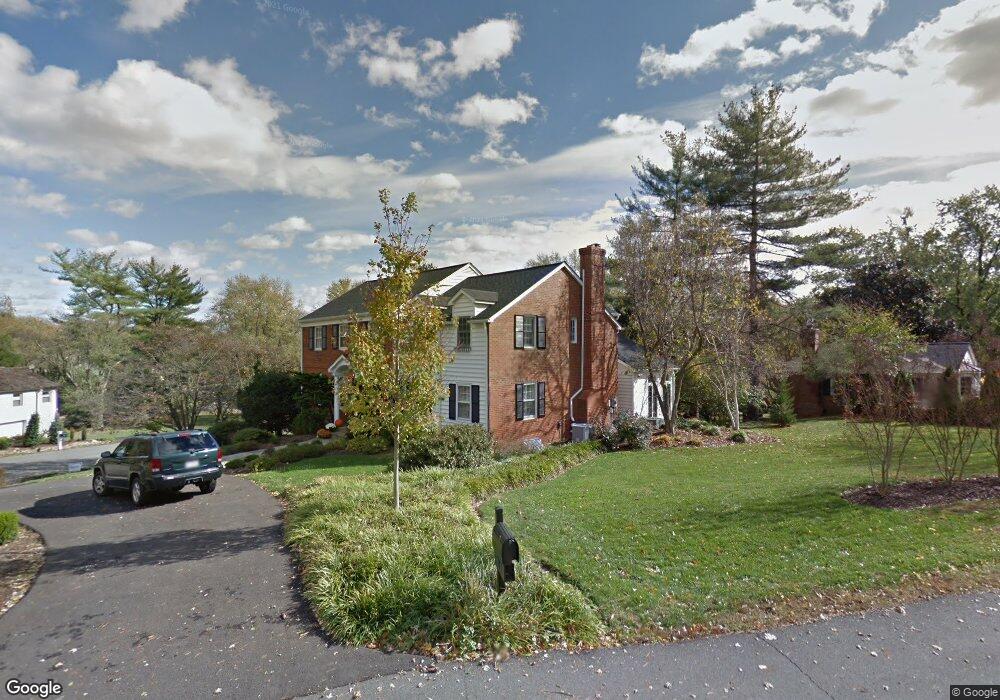
911 Rail Ct McLean, VA 22102
Greenway Heights NeighborhoodEstimated Value: $1,598,144 - $1,956,000
4
Beds
3
Baths
3,113
Sq Ft
$571/Sq Ft
Est. Value
About This Home
This home is located at 911 Rail Ct, McLean, VA 22102 and is currently estimated at $1,776,786, approximately $570 per square foot. 911 Rail Ct is a home located in Fairfax County with nearby schools including Spring Hill Elementary School, Cooper Middle School, and Langley High School.
Ownership History
Date
Name
Owned For
Owner Type
Purchase Details
Closed on
Jun 8, 2015
Sold by
Close George F
Bought by
Close George F
Current Estimated Value
Purchase Details
Closed on
Jun 29, 2006
Sold by
Miller Joseph A
Bought by
Close George F
Home Financials for this Owner
Home Financials are based on the most recent Mortgage that was taken out on this home.
Original Mortgage
$1,040,000
Interest Rate
6.58%
Mortgage Type
New Conventional
Purchase Details
Closed on
Sep 10, 1999
Sold by
Dahan George C
Bought by
Miller Joseph A
Home Financials for this Owner
Home Financials are based on the most recent Mortgage that was taken out on this home.
Original Mortgage
$476,000
Interest Rate
7.65%
Mortgage Type
Purchase Money Mortgage
Create a Home Valuation Report for This Property
The Home Valuation Report is an in-depth analysis detailing your home's value as well as a comparison with similar homes in the area
Home Values in the Area
Average Home Value in this Area
Purchase History
| Date | Buyer | Sale Price | Title Company |
|---|---|---|---|
| Close George F | -- | -- | |
| Close George F | $1,300,000 | -- | |
| Miller Joseph A | $595,000 | -- |
Source: Public Records
Mortgage History
| Date | Status | Borrower | Loan Amount |
|---|---|---|---|
| Previous Owner | Close George F | $1,040,000 | |
| Previous Owner | Miller Joseph A | $476,000 |
Source: Public Records
Tax History Compared to Growth
Tax History
| Year | Tax Paid | Tax Assessment Tax Assessment Total Assessment is a certain percentage of the fair market value that is determined by local assessors to be the total taxable value of land and additions on the property. | Land | Improvement |
|---|---|---|---|---|
| 2025 | $16,084 | $1,480,940 | $825,000 | $655,940 |
| 2024 | $16,084 | $1,361,300 | $755,000 | $606,300 |
| 2023 | $14,335 | $1,244,860 | $685,000 | $559,860 |
| 2022 | $14,209 | $1,218,070 | $675,000 | $543,070 |
| 2021 | $13,373 | $1,117,650 | $623,000 | $494,650 |
| 2020 | $13,093 | $1,085,240 | $605,000 | $480,240 |
| 2019 | $12,630 | $1,046,830 | $605,000 | $441,830 |
| 2018 | $11,291 | $981,820 | $565,000 | $416,820 |
| 2017 | $11,601 | $979,820 | $563,000 | $416,820 |
| 2016 | $10,789 | $913,190 | $536,000 | $377,190 |
| 2015 | $10,969 | $963,020 | $553,000 | $410,020 |
| 2014 | $10,419 | $916,770 | $537,000 | $379,770 |
Source: Public Records
Map
Nearby Homes
- 933 Bellview Rd
- 1006 Kimberwicke Rd
- 8111 Georgetown Pike
- 8023 Georgetown Pike
- 8014 Greenwich Woods Dr
- 8013 Greenwich Woods Dr
- 8340 Springhaven Garden Ln
- 8355 Alvord St
- 8437 Sparger St
- 7816 Georgetown Pike
- 1175 Daleview Dr
- 1033 Union Church Rd
- 1239 Daleview Dr
- 1174 Old Tolson Mill Rd
- 1200 Chadsworth Ct
- 919 Dominion Reserve Dr
- 8757 Brook Rd
- 1197 Winter Hunt Rd
- 8407 Holly Leaf Dr
- 8305 Fox Haven Dr
- 913 Rail Ct
- 8301 Riding Ridge Place
- 8300 Riding Ridge Place
- 8302 Riding Ridge Place
- 910 Rail Ct
- 912 Rail Ct
- 912 Kimberwicke Rd
- 906 Kimberwicke Rd
- 915 Rail Ct
- 8304 Riding Ridge Place
- 914 Rail Ct
- 916 Rail Ct
- 911 Saddleback Ct
- 913 Saddleback Ct
- 905 Kimberwicke Rd
- 914 Kimberwicke Rd
- 8306 Riding Ridge Place
- 8229 Riding Ridge Place
- 911 Kimberwicke Rd
- 8308 Riding Ridge Place