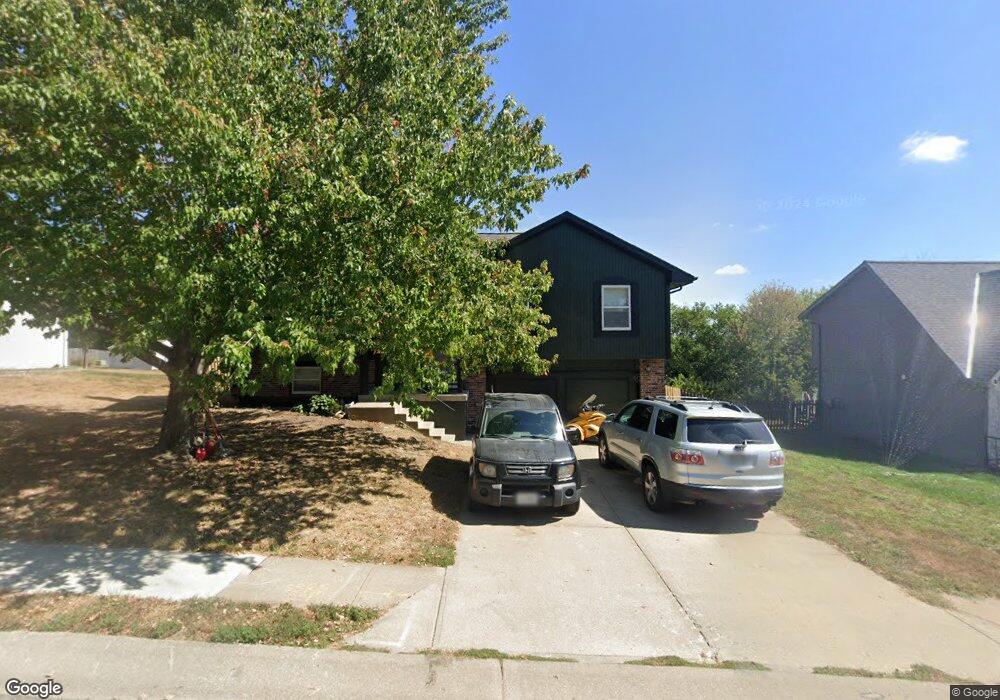
911 SW Abar Dr Grain Valley, MO 64029
Estimated Value: $267,505 - $306,000
3
Beds
3
Baths
1,152
Sq Ft
$254/Sq Ft
Est. Value
About This Home
This home is located at 911 SW Abar Dr, Grain Valley, MO 64029 and is currently estimated at $292,626, approximately $254 per square foot. 911 SW Abar Dr is a home located in Jackson County with nearby schools including Grain Valley High School.
Ownership History
Date
Name
Owned For
Owner Type
Purchase Details
Closed on
Jan 14, 2009
Sold by
Federal Home Loan Mortgage Corporation
Bought by
David Bradley D and David Shena M
Current Estimated Value
Home Financials for this Owner
Home Financials are based on the most recent Mortgage that was taken out on this home.
Original Mortgage
$122,146
Outstanding Balance
$76,128
Interest Rate
4.92%
Mortgage Type
FHA
Estimated Equity
$216,498
Purchase Details
Closed on
Oct 30, 2008
Sold by
Montgomery Dennis L and Montgomery Elizbeth
Bought by
Federal Home Loan Mortgage Corp
Purchase Details
Closed on
Dec 8, 2006
Sold by
Ledger Richard P and Ledger Melanie M
Bought by
Montgomery Dennis L and Montgomery Elizabeth A
Home Financials for this Owner
Home Financials are based on the most recent Mortgage that was taken out on this home.
Original Mortgage
$107,175
Interest Rate
6.3%
Mortgage Type
Purchase Money Mortgage
Create a Home Valuation Report for This Property
The Home Valuation Report is an in-depth analysis detailing your home's value as well as a comparison with similar homes in the area
Home Values in the Area
Average Home Value in this Area
Purchase History
| Date | Buyer | Sale Price | Title Company |
|---|---|---|---|
| David Bradley D | -- | Continental Title Company | |
| Federal Home Loan Mortgage Corp | $108,965 | None Available | |
| Montgomery Dennis L | -- | Owners Land Title Llc |
Source: Public Records
Mortgage History
| Date | Status | Borrower | Loan Amount |
|---|---|---|---|
| Open | David Bradley D | $122,146 | |
| Previous Owner | Montgomery Dennis L | $107,175 |
Source: Public Records
Tax History Compared to Growth
Tax History
| Year | Tax Paid | Tax Assessment Tax Assessment Total Assessment is a certain percentage of the fair market value that is determined by local assessors to be the total taxable value of land and additions on the property. | Land | Improvement |
|---|---|---|---|---|
| 2025 | $3,268 | $36,685 | $10,144 | $26,541 |
| 2024 | $3,146 | $39,674 | $6,950 | $32,724 |
| 2023 | $3,146 | $39,674 | $9,211 | $30,463 |
| 2022 | $2,515 | $27,740 | $3,084 | $24,656 |
| 2021 | $2,456 | $27,740 | $3,084 | $24,656 |
| 2020 | $2,496 | $27,807 | $3,084 | $24,723 |
| 2019 | $2,445 | $27,807 | $3,084 | $24,723 |
| 2018 | $1,600,864 | $24,201 | $2,684 | $21,517 |
| 2017 | $2,277 | $24,201 | $2,684 | $21,517 |
| 2016 | $2,103 | $22,365 | $2,715 | $19,650 |
| 2014 | $2,078 | $21,926 | $2,662 | $19,264 |
Source: Public Records
Map
Nearby Homes
- 913 SW Abar Dr
- 714 SW Brome Dr
- 1010 SW Cross Creek Dr
- 636 SW Lakeview Dr
- 1200 SW Foxtail Dr
- 1203 SW Lakeview Dr
- 1219 SW Windcrest Ct
- 1214 SW Windcrest Ct
- 1215 SW Lone Star Ct
- 1309 SW Graystone Cir
- 725 SW Tisha Ln
- 640 SW Crestview Dr
- 801 SW Apple Grove Ct
- 115 E Old Us 40 Hwy N A
- 621 SW Tisha Ln
- 601 SW Nelson Dr
- 855 SW Ridgeview Dr
- 509 SW Joseph Ct
- 501 SW Creek Ridge Dr
- 808 SW Country Hill Dr
- 909 SW Abar Dr
- 915 SW Abar Dr
- 910 SW Abar Dr
- 912 SW Abar Dr
- 901 SW Abar Dr
- 908 SW Abar Dr
- 910 SW Shorthorn Dr
- 912 SW Shorthorn Dr
- 914 SW Abar Dr
- 914 SW Shorthorn Dr
- 906 SW Abar Dr
- 903 SW Abar Dr
- 906 SW Shorthorn Dr
- 908 SW Shorthorn Dr
- 924 SW Foxtail Dr
- 1000 SW Foxtail Dr
- 916 SW Shorthorn Dr
- 904 SW Shorthorn Dr
- 904 SW Abar Dr
- 1008 SW Foxtail Dr