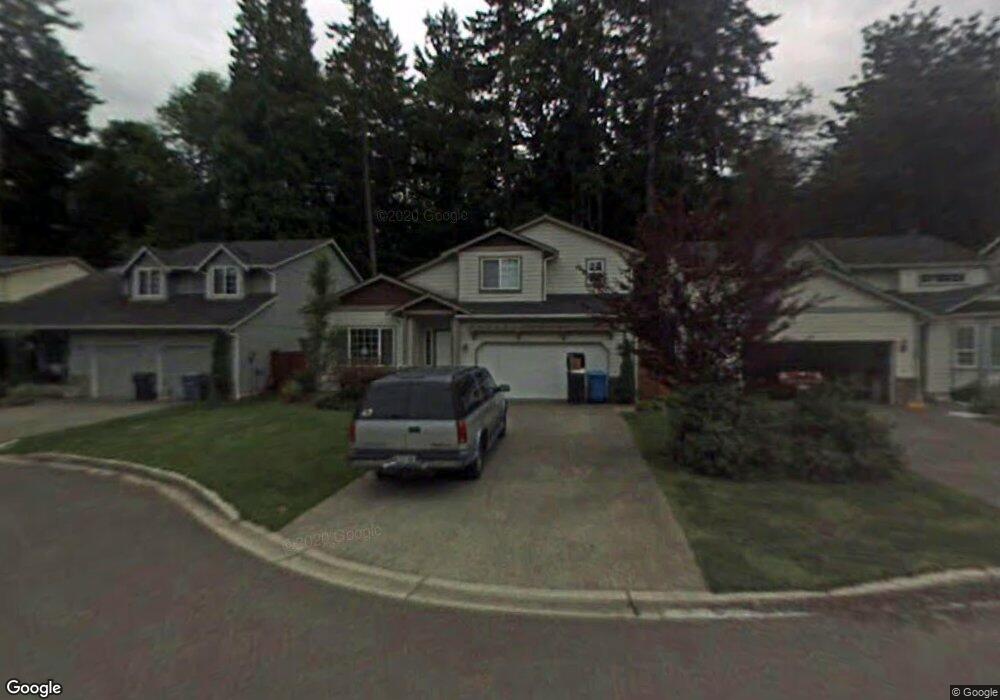
9110 138th St E Puyallup, WA 98373
Estimated Value: $529,273 - $584,000
4
Beds
3
Baths
1,919
Sq Ft
$290/Sq Ft
Est. Value
About This Home
This home is located at 9110 138th St E, Puyallup, WA 98373 and is currently estimated at $555,568, approximately $289 per square foot. 9110 138th St E is a home located in Pierce County with nearby schools including Zeiger Elementary School, Ballou Junior High School, and Gov. John Rogers High School.
Ownership History
Date
Name
Owned For
Owner Type
Purchase Details
Closed on
Mar 18, 2021
Sold by
Patefield Keith and Patefield Marikay
Bought by
Keith And Marikay Patefield Revocable Trust and Patefield
Current Estimated Value
Purchase Details
Closed on
Sep 5, 2006
Sold by
Neil Jesse J and Neil Tiffany L
Bought by
Patefield Keith S and Patefield Marikay
Home Financials for this Owner
Home Financials are based on the most recent Mortgage that was taken out on this home.
Original Mortgage
$253,600
Interest Rate
6.67%
Mortgage Type
Purchase Money Mortgage
Purchase Details
Closed on
Jan 23, 2002
Sold by
Sound Built Homes Inc
Bought by
Neil Jesse J and Neil Tiffany L
Home Financials for this Owner
Home Financials are based on the most recent Mortgage that was taken out on this home.
Original Mortgage
$164,300
Interest Rate
7.17%
Create a Home Valuation Report for This Property
The Home Valuation Report is an in-depth analysis detailing your home's value as well as a comparison with similar homes in the area
Home Values in the Area
Average Home Value in this Area
Purchase History
| Date | Buyer | Sale Price | Title Company |
|---|---|---|---|
| Keith And Marikay Patefield Revocable Trust | -- | None Listed On Document | |
| Patefield Keith S | $317,000 | Talon Group | |
| Neil Jesse J | $201,209 | First American Title Ins Co |
Source: Public Records
Mortgage History
| Date | Status | Borrower | Loan Amount |
|---|---|---|---|
| Previous Owner | Patefield Keith S | $253,600 | |
| Previous Owner | Neil Jesse J | $164,300 |
Source: Public Records
Tax History Compared to Growth
Tax History
| Year | Tax Paid | Tax Assessment Tax Assessment Total Assessment is a certain percentage of the fair market value that is determined by local assessors to be the total taxable value of land and additions on the property. | Land | Improvement |
|---|---|---|---|---|
| 2025 | $4,780 | $477,100 | $146,500 | $330,600 |
| 2024 | $4,780 | $466,800 | $143,300 | $323,500 |
| 2023 | $4,780 | $451,100 | $143,300 | $307,800 |
| 2022 | $4,554 | $460,900 | $160,600 | $300,300 |
| 2021 | $4,338 | $333,800 | $118,200 | $215,600 |
| 2019 | $3,787 | $309,100 | $97,400 | $211,700 |
| 2018 | $3,806 | $288,400 | $84,500 | $203,900 |
| 2017 | $3,518 | $259,000 | $72,800 | $186,200 |
| 2016 | $3,091 | $207,900 | $57,800 | $150,100 |
| 2014 | $2,770 | $189,700 | $50,000 | $139,700 |
| 2013 | $2,770 | $171,000 | $44,300 | $126,700 |
Source: Public Records
Map
Nearby Homes
- 8728 136th St E
- 14308 92nd Ave E
- 9418 133rd St E
- 13421 97th Ave E Unit 104
- 13421 97th Ave E Unit 207
- 13511 97th Ave E Unit 304
- 8501 143rd St E
- 13207 97th Ave E Unit 301
- 12928 95th Avenue Ct E
- 9208 147th St E
- 9005 128th St E
- 9319 128th St E
- 12706 94th Ave E
- Stella Plan at Heritage Heights
- Hadley Plan at Heritage Heights
- Caymen Plan at Heritage Heights
- Warren Plan at Heritage Heights
- Asher Plan at Heritage Heights
- 8005 134th Street Ct E
- 8804 126th St E
- 9106 138th St E
- 9114 138th St E
- 9102 138th St E
- 9107 138th St E
- 9122 138th St E
- 9020 138th St E
- 13709 91st Ave E
- 13703 91st Ave E
- 9016 138th St E
- 9012 138th St E
- 9017 138th St E
- 9008 138th St E
- 9001 138th St NW
- 9009 138th St E
- 9001 138th St E
- 9005 138th St E
- 13814 93rd Ave E
- 9015 137th St E
- 13818 93rd Ave E