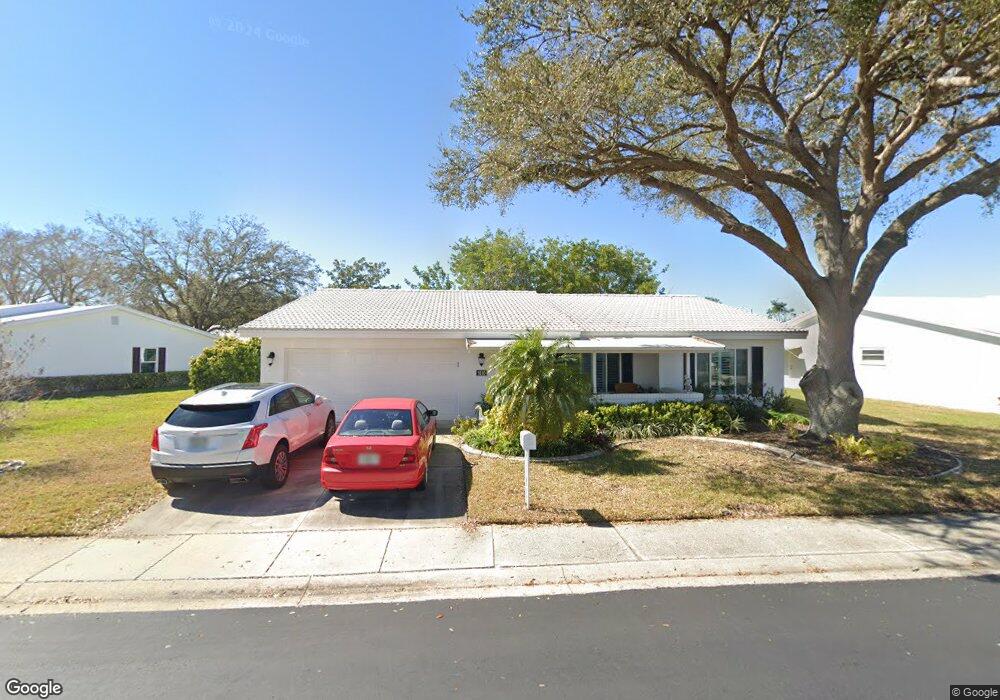
9110 35th St N Unit 6 Pinellas Park, FL 33782
Estimated Value: $386,148 - $402,000
2
Beds
2
Baths
1,794
Sq Ft
$221/Sq Ft
Est. Value
About This Home
This home is located at 9110 35th St N Unit 6, Pinellas Park, FL 33782 and is currently estimated at $395,787, approximately $220 per square foot. 9110 35th St N Unit 6 is a home located in Pinellas County with nearby schools including Pinellas Central Elementary School, Fitzgerald Middle School, and Pinellas Park High School.
Ownership History
Date
Name
Owned For
Owner Type
Purchase Details
Closed on
Sep 3, 2021
Sold by
Wagner Lou Ann and Wagner Kara R
Bought by
Wagner Lou Ann and Lou Ann Wagner
Current Estimated Value
Purchase Details
Closed on
Feb 28, 2020
Sold by
Gliedman Philip H
Bought by
Wagner Lou Ann and Wagner Kara R
Purchase Details
Closed on
Jun 15, 2015
Sold by
Belford Connie T
Bought by
Gliedman Philip H
Home Financials for this Owner
Home Financials are based on the most recent Mortgage that was taken out on this home.
Original Mortgage
$139,900
Interest Rate
3.88%
Mortgage Type
New Conventional
Purchase Details
Closed on
Apr 23, 2010
Sold by
Ray James M and Ray Loretta R
Bought by
Belford Connie T
Purchase Details
Closed on
May 12, 2006
Sold by
Levasseur Eugene R and Levasseur Gloria A
Bought by
Ray James M and Ray Loretta R
Create a Home Valuation Report for This Property
The Home Valuation Report is an in-depth analysis detailing your home's value as well as a comparison with similar homes in the area
Home Values in the Area
Average Home Value in this Area
Purchase History
| Date | Buyer | Sale Price | Title Company |
|---|---|---|---|
| Wagner Lou Ann | -- | Accommodation | |
| Wagner Lou Ann | $265,000 | Capstone Title Llc | |
| Gliedman Philip H | $179,900 | Gold Svc Title Ins Agency Co | |
| Belford Connie T | $162,000 | Fidelity Natl Title Ins Co | |
| Ray James M | $235,000 | Gold Service Title Ins Co |
Source: Public Records
Mortgage History
| Date | Status | Borrower | Loan Amount |
|---|---|---|---|
| Previous Owner | Gliedman Philip H | $139,900 |
Source: Public Records
Tax History Compared to Growth
Tax History
| Year | Tax Paid | Tax Assessment Tax Assessment Total Assessment is a certain percentage of the fair market value that is determined by local assessors to be the total taxable value of land and additions on the property. | Land | Improvement |
|---|---|---|---|---|
| 2024 | $3,941 | $239,972 | -- | -- |
| 2023 | $3,941 | $232,002 | $0 | $0 |
| 2022 | $3,915 | $225,245 | $0 | $0 |
| 2021 | $3,881 | $218,684 | $0 | $0 |
| 2020 | $2,439 | $153,609 | $0 | $0 |
| 2019 | $2,384 | $150,155 | $0 | $0 |
| 2018 | $2,341 | $147,355 | $0 | $0 |
| 2017 | $2,309 | $144,324 | $0 | $0 |
| 2016 | $2,277 | $141,356 | $0 | $0 |
| 2015 | $1,310 | $104,474 | $0 | $0 |
| 2014 | -- | $103,645 | $0 | $0 |
Source: Public Records
Map
Nearby Homes
- 9130 34th Way N Unit 6
- 9125 35th Way N
- 9220 36th Way N Unit 6
- 9255 36th Way N
- 9639 Mainlands Blvd E
- 3915 90th Terrace N
- 9125 39th Ln N
- 9218 39th Ln N
- 9737 36th Way N
- 9843 34th Way N Unit 4
- 9150 40th St N Unit 5
- 9813 37th St N
- 9201 40th Way
- 82037 5th Ave Unit 37
- 3490 99th Place N
- 3643 Mainlands Blvd N
- 3559 100th Ave N
- 9226 41st St N
- 4002 87th Terrace
- 9920 39th St N
- 9110 35th St N
- 9120 35th St N
- 9020 35th St N
- 9020 35th St N Unit 6
- 9065 35th Way N
- 9115 35th St N
- 9055 35th Way N Unit 15
- 9055 35th Way N Unit 6
- 9105 35th St N
- 9105 35th Way N
- 9130 35th St N
- 9125 35th St N Unit 200
- 9125 35th St N Unit 6
- 9125 35th St N
- 9025 35th St N
- 9010 35th St N Unit 6
- 9010 35th St N
- 9115 35th Way N Unit 6
- 9115 35th Way N
- 9045 35th Way N