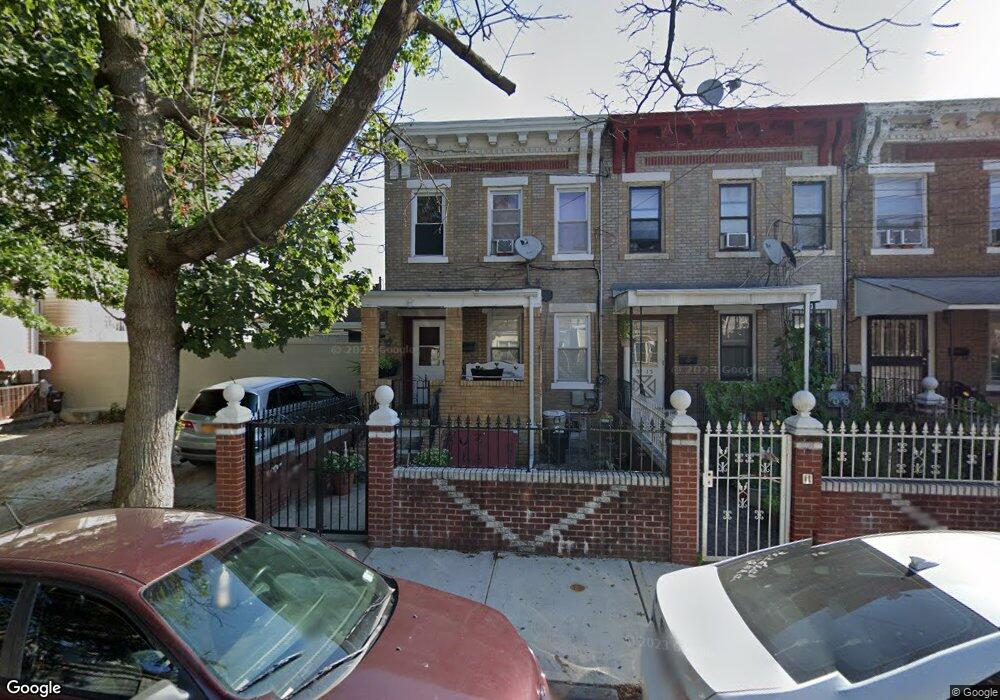
9111 86th St Woodhaven, NY 11421
Woodhaven NeighborhoodEstimated Value: $683,345 - $740,000
3
Beds
2
Baths
1,284
Sq Ft
$556/Sq Ft
Est. Value
About This Home
This home is located at 9111 86th St, Woodhaven, NY 11421 and is currently estimated at $713,586, approximately $555 per square foot. 9111 86th St is a home located in Queens County with nearby schools including P.S. 060 Woodhaven, Jhs 210 Elizabeth Blackwell, and St. Thomas the Apostle Catholic Academy.
Ownership History
Date
Name
Owned For
Owner Type
Purchase Details
Closed on
Dec 5, 2022
Sold by
Yan Jin Ying and Zheng Bizhu
Bought by
Yan Jin Ying
Current Estimated Value
Purchase Details
Closed on
Feb 26, 2020
Sold by
Lin Da Xin
Bought by
Yan Jin Ying and Zheng Bizhu
Home Financials for this Owner
Home Financials are based on the most recent Mortgage that was taken out on this home.
Original Mortgage
$300,000
Outstanding Balance
$265,186
Interest Rate
3.4%
Mortgage Type
Unknown
Estimated Equity
$448,400
Purchase Details
Closed on
Jan 26, 2016
Sold by
Panetta Attilio and Panetta Loretta
Bought by
Lin Daxin
Create a Home Valuation Report for This Property
The Home Valuation Report is an in-depth analysis detailing your home's value as well as a comparison with similar homes in the area
Home Values in the Area
Average Home Value in this Area
Purchase History
| Date | Buyer | Sale Price | Title Company |
|---|---|---|---|
| Yan Jin Ying | -- | -- | |
| Yan Jin Ying | $612,000 | -- | |
| Lin Daxin | $423,000 | -- |
Source: Public Records
Mortgage History
| Date | Status | Borrower | Loan Amount |
|---|---|---|---|
| Open | Yan Jin Ying | $300,000 |
Source: Public Records
Tax History Compared to Growth
Tax History
| Year | Tax Paid | Tax Assessment Tax Assessment Total Assessment is a certain percentage of the fair market value that is determined by local assessors to be the total taxable value of land and additions on the property. | Land | Improvement |
|---|---|---|---|---|
| 2025 | $5,394 | $27,060 | $8,722 | $18,338 |
| 2024 | $5,394 | $26,854 | $9,315 | $17,539 |
| 2023 | $5,088 | $25,334 | $7,953 | $17,381 |
| 2022 | $3,579 | $39,180 | $12,300 | $26,880 |
| 2021 | $4,746 | $38,940 | $12,300 | $26,640 |
| 2020 | $4,773 | $34,620 | $12,300 | $22,320 |
| 2019 | $4,681 | $33,960 | $12,300 | $21,660 |
| 2018 | $4,304 | $21,112 | $9,348 | $11,764 |
| 2017 | $4,060 | $19,918 | $9,176 | $10,742 |
| 2016 | $3,757 | $19,918 | $9,176 | $10,742 |
| 2015 | $2,047 | $18,792 | $12,069 | $6,723 |
| 2014 | $2,047 | $18,649 | $13,043 | $5,606 |
Source: Public Records
Map
Nearby Homes