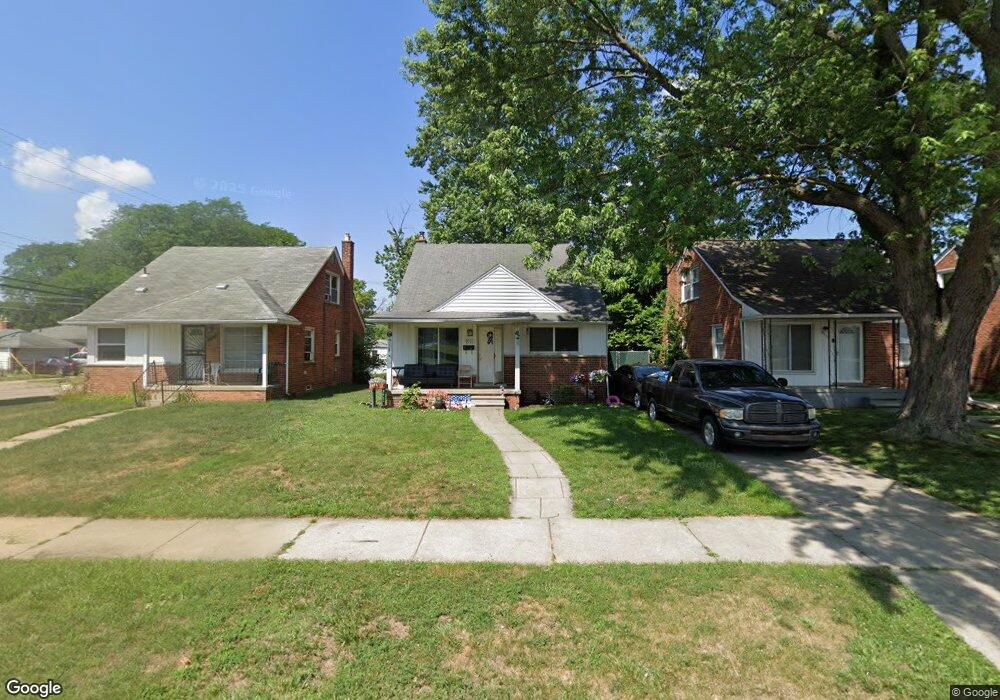
9111 Fenton Redford, MI 48239
Estimated Value: $170,000 - $210,000
--
Bed
1
Bath
1,275
Sq Ft
$152/Sq Ft
Est. Value
About This Home
This home is located at 9111 Fenton, Redford, MI 48239 and is currently estimated at $193,579, approximately $151 per square foot. 9111 Fenton is a home located in Wayne County with nearby schools including John D. Pierce Middle School, Lee M. Thurston High School, and Global Heights Academy.
Ownership History
Date
Name
Owned For
Owner Type
Purchase Details
Closed on
Apr 24, 2007
Sold by
Fannie Mae
Bought by
Zezawa Nanette
Current Estimated Value
Purchase Details
Closed on
Mar 17, 2006
Sold by
Mortgage Electronic Registration Systems
Bought by
Federal National Mortgage Association
Purchase Details
Closed on
Mar 8, 2006
Sold by
Cunningham Gerald and Cunningham Sherry
Bought by
Mortgage Electronic Registration Systems
Purchase Details
Closed on
Nov 26, 2003
Sold by
Burbo Nelson J and Camilleri Martin
Bought by
Cunningham Gerald
Purchase Details
Closed on
Apr 11, 2000
Sold by
Ford Helen J
Bought by
Burbo Nelson
Create a Home Valuation Report for This Property
The Home Valuation Report is an in-depth analysis detailing your home's value as well as a comparison with similar homes in the area
Home Values in the Area
Average Home Value in this Area
Purchase History
| Date | Buyer | Sale Price | Title Company |
|---|---|---|---|
| Zezawa Nanette | $93,000 | None Available | |
| Federal National Mortgage Association | -- | None Available | |
| Mortgage Electronic Registration Systems | $171,048 | None Available | |
| Cunningham Gerald | $133,900 | Metropolitan Title Company | |
| Burbo Nelson | -- | -- |
Source: Public Records
Tax History Compared to Growth
Tax History
| Year | Tax Paid | Tax Assessment Tax Assessment Total Assessment is a certain percentage of the fair market value that is determined by local assessors to be the total taxable value of land and additions on the property. | Land | Improvement |
|---|---|---|---|---|
| 2025 | $764 | $84,200 | $0 | $0 |
| 2024 | $764 | $78,500 | $0 | $0 |
| 2023 | $732 | $67,800 | $0 | $0 |
| 2022 | $2,153 | $57,900 | $0 | $0 |
| 2021 | $2,092 | $54,400 | $0 | $0 |
| 2020 | $2,064 | $49,800 | $0 | $0 |
| 2019 | $2,020 | $43,100 | $0 | $0 |
| 2018 | $659 | $37,300 | $0 | $0 |
| 2017 | $2,279 | $34,600 | $0 | $0 |
| 2016 | $2,123 | $35,900 | $0 | $0 |
| 2015 | $2,766 | $33,000 | $0 | $0 |
| 2013 | $2,680 | $27,400 | $0 | $0 |
| 2012 | $1,702 | $30,500 | $6,600 | $23,900 |
Source: Public Records
Map
Nearby Homes