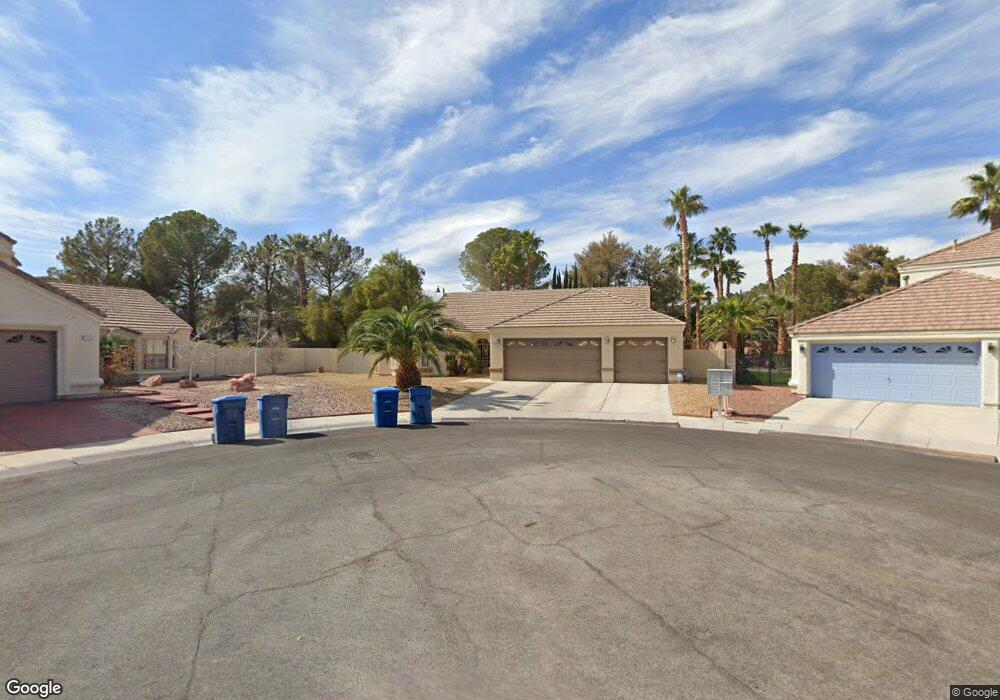
9112 Anchor Cove Ct Las Vegas, NV 89117
The Lakes NeighborhoodEstimated Value: $594,635 - $661,000
4
Beds
2
Baths
2,203
Sq Ft
$285/Sq Ft
Est. Value
About This Home
This home is located at 9112 Anchor Cove Ct, Las Vegas, NV 89117 and is currently estimated at $627,159, approximately $284 per square foot. 9112 Anchor Cove Ct is a home located in Clark County with nearby schools including M J Christensen Elementary School, Clifford J Lawrence Junior High School, and Spring Valley High School.
Ownership History
Date
Name
Owned For
Owner Type
Purchase Details
Closed on
Jun 9, 2014
Sold by
Loh William
Bought by
Loh William W and Loh Family Trust
Current Estimated Value
Purchase Details
Closed on
Apr 21, 2006
Sold by
Trenshaw Stephen C
Bought by
Loh William
Home Financials for this Owner
Home Financials are based on the most recent Mortgage that was taken out on this home.
Original Mortgage
$330,000
Outstanding Balance
$188,872
Interest Rate
6.29%
Mortgage Type
Fannie Mae Freddie Mac
Estimated Equity
$438,287
Purchase Details
Closed on
Feb 8, 2002
Sold by
Trenshaw Judith A
Bought by
Trenshaw Stephen C
Home Financials for this Owner
Home Financials are based on the most recent Mortgage that was taken out on this home.
Original Mortgage
$164,000
Interest Rate
7.25%
Create a Home Valuation Report for This Property
The Home Valuation Report is an in-depth analysis detailing your home's value as well as a comparison with similar homes in the area
Home Values in the Area
Average Home Value in this Area
Purchase History
| Date | Buyer | Sale Price | Title Company |
|---|---|---|---|
| Loh William W | -- | None Available | |
| Loh William | $440,000 | Ticor Title Of Nevada Inc | |
| Trenshaw Stephen C | -- | Ticor Title Of Nevada Inc | |
| Trenshaw Stephen C | $205,000 | Fidelity National Title |
Source: Public Records
Mortgage History
| Date | Status | Borrower | Loan Amount |
|---|---|---|---|
| Open | Loh William | $330,000 | |
| Previous Owner | Trenshaw Stephen C | $164,000 |
Source: Public Records
Tax History Compared to Growth
Tax History
| Year | Tax Paid | Tax Assessment Tax Assessment Total Assessment is a certain percentage of the fair market value that is determined by local assessors to be the total taxable value of land and additions on the property. | Land | Improvement |
|---|---|---|---|---|
| 2025 | $2,731 | $122,688 | $51,450 | $71,238 |
| 2024 | $2,652 | $122,688 | $51,450 | $71,238 |
| 2023 | $2,652 | $120,079 | $51,450 | $68,629 |
| 2022 | $2,575 | $102,773 | $38,955 | $63,818 |
| 2021 | $2,500 | $94,627 | $33,443 | $61,184 |
| 2020 | $2,424 | $93,924 | $32,708 | $61,216 |
| 2019 | $2,353 | $93,005 | $32,200 | $60,805 |
| 2018 | $2,285 | $92,340 | $33,005 | $59,335 |
| 2017 | $3,075 | $93,778 | $33,005 | $60,773 |
| 2016 | $2,162 | $84,195 | $22,943 | $61,252 |
| 2015 | $2,157 | $76,154 | $15,698 | $60,456 |
| 2014 | $2,094 | $70,894 | $12,075 | $58,819 |
Source: Public Records
Map
Nearby Homes
- 9113 Anchor Cove Ct
- 9100 Shelter Cove Ct
- 2913 Domino Way
- 9021 Feather River Ct
- 3040 Ocean Port Dr
- 9429 Abalone Way
- 2825 Waterview Dr
- 3009 Periscope Ct
- 8924 Sail Bay Dr
- 2712 Quail Roost Way
- 3120 Waterview Dr
- 9312 Angelfish Dr
- 8913 Antioch Way
- 8932 Antioch Way
- 2761 Lodestone Dr Unit 63
- 2757 Lodestone Dr Unit 59
- 2940 Crystal Bay Dr
- 9028 Cypress Point Way
- 3205 Bermuda Bay St
- 9105 Cypress Point Way
- 9108 Anchor Cove Ct
- 9109 Emerald Cove Ct Unit n/a
- 9109 Emerald Cove Ct
- 9113 Emerald Cove Ct
- 9104 Anchor Cove Ct
- 9105 Emerald Cove Ct
- 9105 Anchor Cove Ct
- 9100 Anchor Cove Ct
- 2916 Domino Way
- 2920 Domino Way
- 9108 Shelter Cove Ct
- 9112 Shelter Cove Ct
- 9101 Emerald Cove Ct
- 9101 Anchor Cove Ct
- 9112 Emerald Cove Ct
- 2824 Deep Water Cir
- 2828 Deep Water Cir
- 2924 Domino Way Unit N
- 2924 Domino Way
- 9104 Shelter Cove Ct