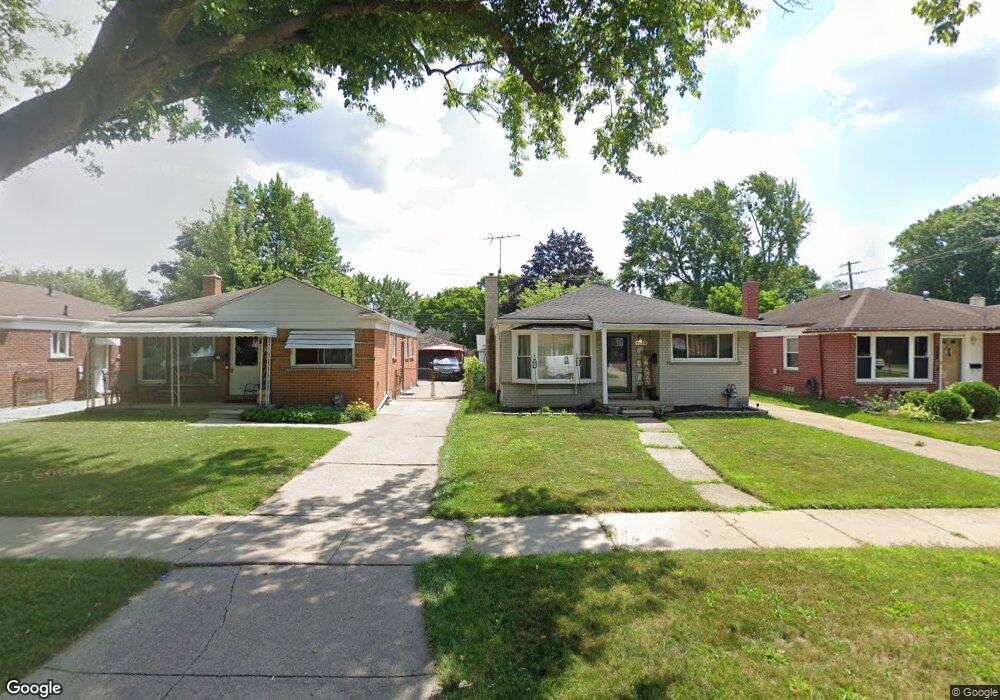
9112 Salem Redford, MI 48239
Estimated Value: $189,237 - $221,000
--
Bed
1
Bath
997
Sq Ft
$201/Sq Ft
Est. Value
About This Home
This home is located at 9112 Salem, Redford, MI 48239 and is currently estimated at $200,559, approximately $201 per square foot. 9112 Salem is a home located in Wayne County with nearby schools including John D. Pierce Middle School, Lee M. Thurston High School, and Global Heights Academy.
Ownership History
Date
Name
Owned For
Owner Type
Purchase Details
Closed on
May 19, 2009
Sold by
Ochoa Alberto and Ochoa Maria E
Bought by
Magana Salvador Ochoa
Current Estimated Value
Purchase Details
Closed on
Jun 19, 2006
Sold by
Ochoa Cornelio and Ochoa Maria T
Bought by
Ochoa Alberto
Purchase Details
Closed on
May 18, 2000
Sold by
Ruthanne S Lhiva
Bought by
Cornelio Ochoa
Purchase Details
Closed on
Feb 20, 1998
Sold by
Ba Kenneth J and Ba Suzanne M
Bought by
Chesney Ruthanne S
Create a Home Valuation Report for This Property
The Home Valuation Report is an in-depth analysis detailing your home's value as well as a comparison with similar homes in the area
Home Values in the Area
Average Home Value in this Area
Purchase History
| Date | Buyer | Sale Price | Title Company |
|---|---|---|---|
| Magana Salvador Ochoa | $50,000 | None Available | |
| Ochoa Alberto | -- | None Available | |
| Cornelio Ochoa | $115,000 | -- | |
| Chesney Ruthanne S | $96,000 | -- |
Source: Public Records
Tax History Compared to Growth
Tax History
| Year | Tax Paid | Tax Assessment Tax Assessment Total Assessment is a certain percentage of the fair market value that is determined by local assessors to be the total taxable value of land and additions on the property. | Land | Improvement |
|---|---|---|---|---|
| 2025 | $709 | $82,200 | $0 | $0 |
| 2024 | $709 | $77,000 | $0 | $0 |
| 2023 | $679 | $69,400 | $0 | $0 |
| 2022 | $2,012 | $58,100 | $0 | $0 |
| 2021 | $2,193 | $53,200 | $0 | $0 |
| 2020 | $2,039 | $47,300 | $0 | $0 |
| 2019 | $1,870 | $42,800 | $0 | $0 |
| 2018 | $605 | $34,700 | $0 | $0 |
| 2017 | $2,092 | $32,900 | $0 | $0 |
| 2016 | $1,630 | $30,900 | $0 | $0 |
| 2015 | $2,539 | $27,900 | $0 | $0 |
| 2013 | $2,460 | $25,100 | $0 | $0 |
| 2012 | $1,559 | $27,800 | $6,700 | $21,100 |
Source: Public Records
Map
Nearby Homes