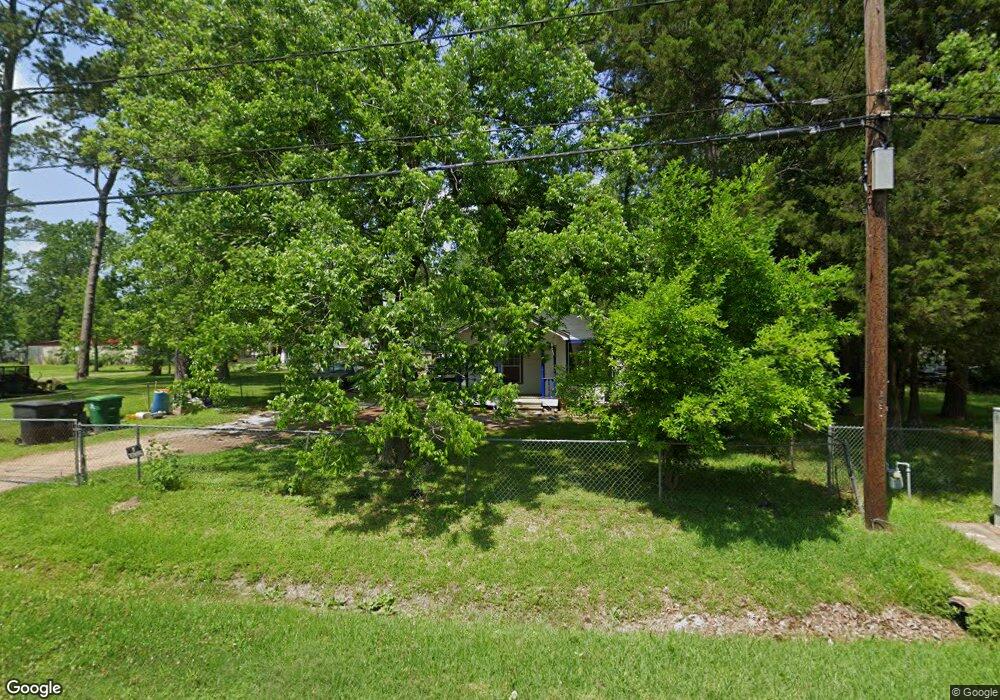
9113 Lanewood Dr Houston, TX 77016
Trinity-Houston Gardens NeighborhoodEstimated Value: $125,000 - $165,000
2
Beds
1
Bath
866
Sq Ft
$164/Sq Ft
Est. Value
About This Home
This home is located at 9113 Lanewood Dr, Houston, TX 77016 and is currently estimated at $141,896, approximately $163 per square foot. 9113 Lanewood Dr is a home located in Harris County with nearby schools including Felix Cook Jr. Elementary School, Key Middle, and Kashmere High School.
Ownership History
Date
Name
Owned For
Owner Type
Purchase Details
Closed on
Dec 3, 2007
Sold by
Jet Investors Lending Llc
Bought by
Taylor John L
Current Estimated Value
Home Financials for this Owner
Home Financials are based on the most recent Mortgage that was taken out on this home.
Original Mortgage
$63,993
Outstanding Balance
$40,714
Interest Rate
6.4%
Mortgage Type
FHA
Estimated Equity
$101,182
Purchase Details
Closed on
Aug 7, 2007
Sold by
Owens Sarah J
Bought by
Jet Investor Lending Llc
Purchase Details
Closed on
Mar 14, 2000
Sold by
Stewart Theodore R
Bought by
Owens Sarah J
Purchase Details
Closed on
Feb 15, 1999
Sold by
Broughton W S
Bought by
Stewart Theodore R
Home Financials for this Owner
Home Financials are based on the most recent Mortgage that was taken out on this home.
Original Mortgage
$23,500
Interest Rate
6.74%
Mortgage Type
Seller Take Back
Create a Home Valuation Report for This Property
The Home Valuation Report is an in-depth analysis detailing your home's value as well as a comparison with similar homes in the area
Home Values in the Area
Average Home Value in this Area
Purchase History
| Date | Buyer | Sale Price | Title Company |
|---|---|---|---|
| Taylor John L | -- | Texas American Title Company | |
| Jet Investor Lending Llc | $46,880 | None Available | |
| Owens Sarah J | -- | -- | |
| Stewart Theodore R | -- | -- |
Source: Public Records
Mortgage History
| Date | Status | Borrower | Loan Amount |
|---|---|---|---|
| Open | Taylor John L | $63,993 | |
| Previous Owner | Stewart Theodore R | $23,500 | |
| Closed | Owens Sarah J | $0 |
Source: Public Records
Tax History
| Year | Tax Paid | Tax Assessment Tax Assessment Total Assessment is a certain percentage of the fair market value that is determined by local assessors to be the total taxable value of land and additions on the property. | Land | Improvement |
|---|---|---|---|---|
| 2025 | $457 | $102,129 | $51,795 | $50,334 |
| 2024 | $457 | $101,040 | $51,795 | $49,245 |
| 2023 | $457 | $85,942 | $38,846 | $47,096 |
| 2022 | $847 | $61,696 | $25,898 | $35,798 |
| 2021 | $815 | $46,772 | $17,265 | $29,507 |
| 2020 | $770 | $42,806 | $17,265 | $25,541 |
| 2019 | $732 | $36,789 | $13,812 | $22,977 |
| 2018 | $279 | $29,780 | $13,812 | $15,968 |
| 2017 | $604 | $29,780 | $13,812 | $15,968 |
| 2016 | $549 | $23,217 | $10,791 | $12,426 |
| 2015 | $203 | $19,748 | $9,927 | $9,821 |
| 2014 | $203 | $19,748 | $9,927 | $9,821 |
Source: Public Records
Map
Nearby Homes
- 9205 & 9207 Spaulding St
- 9226 Lanewood Dr
- 8914 Lanewood Dr
- 9227 Homestead Rd
- 8504 Shady Dr
- 8928 Homestead Rd
- 6513 Laura Koppe Rd
- 5009 Tidwell Rd
- 6110 Tidwell Rd
- 6514 Laura Koppe Rd
- 8723 Compton St
- 8719 Compton St
- 6320 Laura Koppe Rd
- 9306 Bertwood St
- 8706 Camay Dr
- 9314 Sundown Dr
- 8700 Lanewood Dr
- 9011 Allwood St
- 8711 Westcott Rd Unit A and B
- 8709 Westcott Rd Unit A and B
- 9115 Lanewood Dr
- 9101 Lanewood Dr
- 9117 Lanewood Dr
- 9114 Compton St
- 9112 Compton St
- 9110 Compton St
- 9027 Lanewood Dr
- 6410 Firnat St
- 9106 Compton St
- 9112 Lanewood Dr
- 9118 Compton St
- 9108 Lanewood Dr
- 9106 Lanewood Dr
- 9022 Compton St
- 9104 Lanewood Dr
- 9023 Lanewood Dr
- 9023 Lanewood Dr
- 9023 Lanewood Dr Unit B
- 9023 Lanewood Dr Unit A
- 6502 Firnat St
Your Personal Tour Guide
Ask me questions while you tour the home.