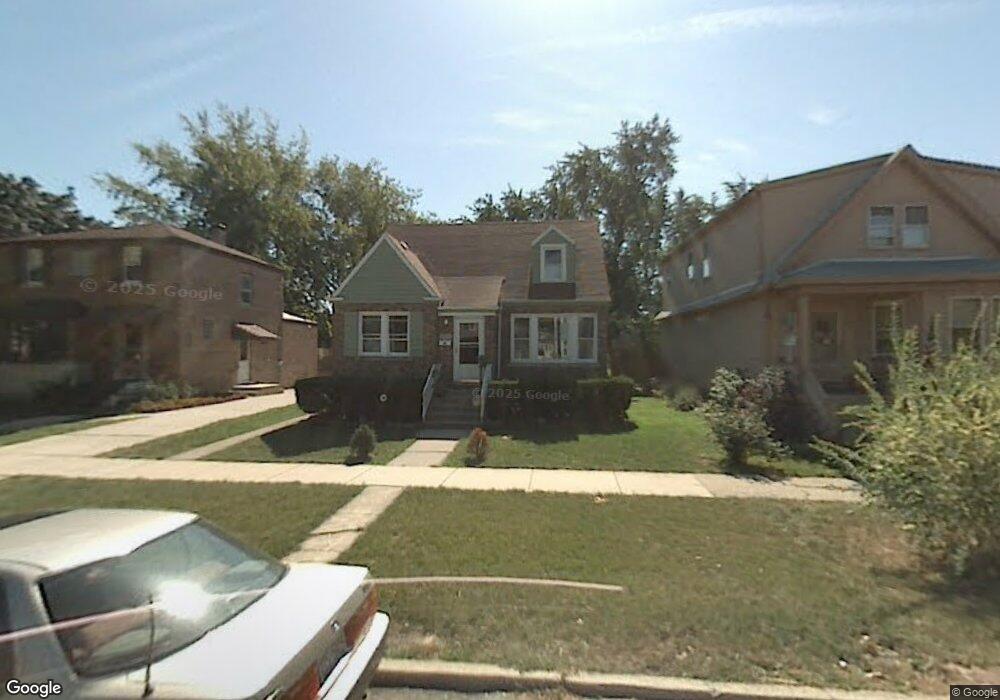
9115 Sherman Ave Brookfield, IL 60513
Estimated Value: $181,000 - $357,000
3
Beds
2
Baths
1,614
Sq Ft
$176/Sq Ft
Est. Value
About This Home
This home is located at 9115 Sherman Ave, Brookfield, IL 60513 and is currently estimated at $284,740, approximately $176 per square foot. 9115 Sherman Ave is a home located in Cook County with nearby schools including S. E. Gross Middle School, Brook Park Elementary School, and Riverside Brookfield High School.
Ownership History
Date
Name
Owned For
Owner Type
Purchase Details
Closed on
Dec 22, 2025
Sold by
Value Properties Inc
Bought by
Modern Living Space Inc
Current Estimated Value
Home Financials for this Owner
Home Financials are based on the most recent Mortgage that was taken out on this home.
Original Mortgage
$295,000
Interest Rate
6.27%
Mortgage Type
Construction
Purchase Details
Closed on
Nov 13, 2025
Sold by
Losos James T and Losos Sofia P
Bought by
Value Properties Inc
Home Financials for this Owner
Home Financials are based on the most recent Mortgage that was taken out on this home.
Original Mortgage
$295,000
Interest Rate
6.27%
Mortgage Type
Construction
Purchase Details
Closed on
Sep 27, 2001
Sold by
Socha Eugene and Socha Anne M
Bought by
Losos James T and Losos Sofia P
Home Financials for this Owner
Home Financials are based on the most recent Mortgage that was taken out on this home.
Original Mortgage
$153,600
Interest Rate
6.88%
Purchase Details
Closed on
Sep 30, 1998
Sold by
Schander Keith J and Schander Dr Brian C
Bought by
Socha Eugene and Socha Anne M
Home Financials for this Owner
Home Financials are based on the most recent Mortgage that was taken out on this home.
Original Mortgage
$105,000
Interest Rate
6.9%
Purchase Details
Closed on
Mar 25, 1998
Sold by
Schander Keith J and Schander Dr Brian C
Bought by
Schander Keith J and Schander Dr Brian C
Purchase Details
Closed on
Dec 6, 1995
Sold by
Cosmopolitan Bank & Trust
Bought by
Schander Janice M and Schander Keith J
Create a Home Valuation Report for This Property
The Home Valuation Report is an in-depth analysis detailing your home's value as well as a comparison with similar homes in the area
Home Values in the Area
Average Home Value in this Area
Purchase History
| Date | Buyer | Sale Price | Title Company |
|---|---|---|---|
| Modern Living Space Inc | $250,000 | Greater Illinois Title | |
| Value Properties Inc | $180,000 | None Listed On Document | |
| Losos James T | $192,000 | -- | |
| Socha Eugene | $145,000 | -- | |
| Schander Keith J | -- | -- | |
| Schander Janice M | -- | -- |
Source: Public Records
Mortgage History
| Date | Status | Borrower | Loan Amount |
|---|---|---|---|
| Previous Owner | Value Properties Inc | $295,000 | |
| Previous Owner | Losos James T | $153,600 | |
| Previous Owner | Socha Eugene | $105,000 | |
| Closed | Losos James T | $28,800 |
Source: Public Records
Tax History
| Year | Tax Paid | Tax Assessment Tax Assessment Total Assessment is a certain percentage of the fair market value that is determined by local assessors to be the total taxable value of land and additions on the property. | Land | Improvement |
|---|---|---|---|---|
| 2025 | $9,171 | $29,000 | $3,515 | $25,485 |
| 2024 | $9,171 | $29,000 | $3,515 | $25,485 |
| 2023 | $7,802 | $29,000 | $3,515 | $25,485 |
| 2022 | $7,802 | $22,146 | $3,047 | $19,099 |
| 2021 | $7,605 | $22,144 | $3,046 | $19,098 |
| 2020 | $7,498 | $22,144 | $3,046 | $19,098 |
| 2019 | $9,222 | $26,815 | $2,695 | $24,120 |
| 2018 | $8,853 | $26,815 | $2,695 | $24,120 |
| 2017 | $8,182 | $26,815 | $2,695 | $24,120 |
| 2016 | $5,935 | $18,441 | $2,460 | $15,981 |
| 2015 | $5,660 | $18,441 | $2,460 | $15,981 |
| 2014 | $6,502 | $18,441 | $2,460 | $15,981 |
| 2013 | $6,917 | $21,002 | $2,460 | $18,542 |
Source: Public Records
Map
Nearby Homes
- 3545 Oak Ave
- 9011 Sheridan Ave
- 3730 Madison Ave
- 9031 Fairview Ave
- 3417 Oak Ave
- 9016 Southview Ave
- 3533 Morton Ave
- 3837 Morton Ave
- 3321 Harrison Ave
- 3229 Maple Ave
- 4023 Oak Ave
- 9512 Jefferson Ave
- 4021 Deyo Ave
- 3201 Park Ave
- 3227 Harrison Ave
- 4032 Prairie Ave
- 3901 Custer Ave
- 1018 E Oak Ave
- 9516 Jackson Ave
- 3108 Oak Ave
- 9119 Sherman Ave
- 9111 Sherman Ave
- 9123 Sherman Ave
- 9105 Sherman Ave
- 9105 Sherman Ave
- 9112 Grant Ave
- 9118 Grant Ave
- 9127 Sherman Ave
- 9110 Grant Ave
- 9122 Grant Ave
- 9103 Sherman Ave
- 9108 Grant Ave
- 9116 Sherman Ave
- 9126 Grant Ave
- 9112 Sherman Ave
- 9131 Sherman Ave
- 9120 Sherman Ave
- 9110 Sherman Ave
- 9102 Grant Ave
- 9133 Sherman Ave
Your Personal Tour Guide
Ask me questions while you tour the home.