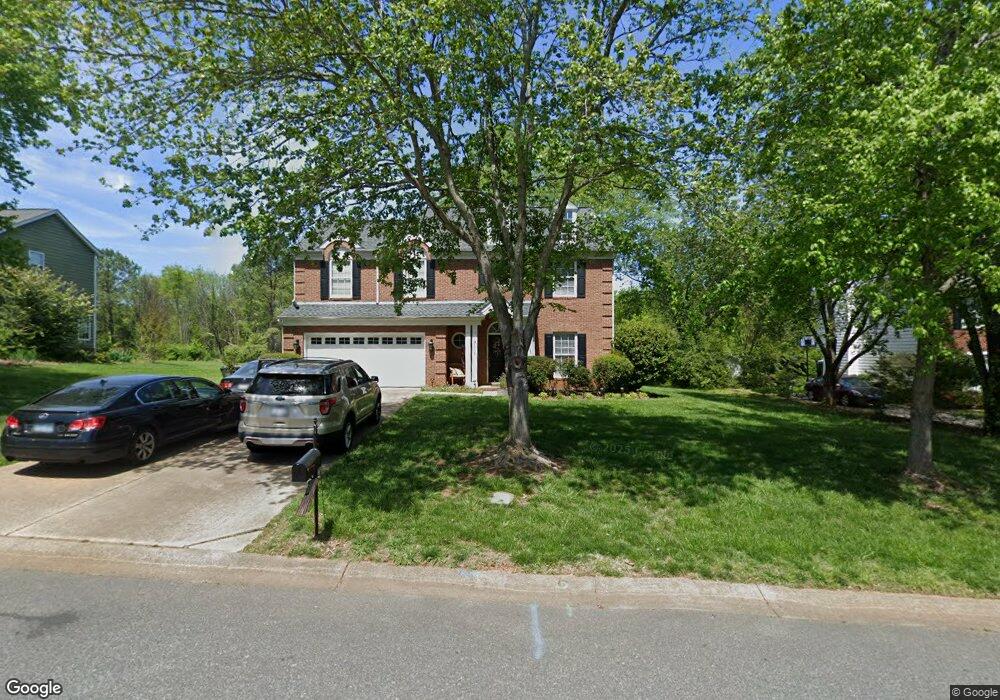
9115 Torrence Crossing Dr Huntersville, NC 28078
Estimated Value: $469,000 - $494,000
3
Beds
3
Baths
2,294
Sq Ft
$211/Sq Ft
Est. Value
About This Home
This home is located at 9115 Torrence Crossing Dr, Huntersville, NC 28078 and is currently estimated at $483,539, approximately $210 per square foot. 9115 Torrence Crossing Dr is a home located in Mecklenburg County with nearby schools including Torrence Creek Elementary School, Francis Bradley Middle School, and Hopewell High.
Ownership History
Date
Name
Owned For
Owner Type
Purchase Details
Closed on
Aug 15, 2007
Sold by
Edison Michael and Edison Jeanne M
Bought by
Howder Mark L and Howder Yvonne J
Current Estimated Value
Home Financials for this Owner
Home Financials are based on the most recent Mortgage that was taken out on this home.
Original Mortgage
$230,000
Interest Rate
6.27%
Mortgage Type
Purchase Money Mortgage
Purchase Details
Closed on
May 27, 2001
Sold by
Smith Sean P and Smith Jeni A
Bought by
Edison Michael and Edison Jeanne M
Home Financials for this Owner
Home Financials are based on the most recent Mortgage that was taken out on this home.
Original Mortgage
$95,000
Interest Rate
7.11%
Mortgage Type
Purchase Money Mortgage
Purchase Details
Closed on
Dec 21, 1998
Sold by
Duncan Gregory L and Duncan Tamatha L
Bought by
Smith Sean P and Smith Jeni A
Home Financials for this Owner
Home Financials are based on the most recent Mortgage that was taken out on this home.
Original Mortgage
$148,675
Interest Rate
6.9%
Mortgage Type
Purchase Money Mortgage
Create a Home Valuation Report for This Property
The Home Valuation Report is an in-depth analysis detailing your home's value as well as a comparison with similar homes in the area
Home Values in the Area
Average Home Value in this Area
Purchase History
| Date | Buyer | Sale Price | Title Company |
|---|---|---|---|
| Howder Mark L | $230,000 | None Available | |
| Edison Michael | $166,500 | -- | |
| Smith Sean P | $156,500 | -- |
Source: Public Records
Mortgage History
| Date | Status | Borrower | Loan Amount |
|---|---|---|---|
| Previous Owner | Howder Mark L | $230,000 | |
| Previous Owner | Edison Michael | $95,000 | |
| Previous Owner | Smith Sean P | $148,675 |
Source: Public Records
Tax History Compared to Growth
Tax History
| Year | Tax Paid | Tax Assessment Tax Assessment Total Assessment is a certain percentage of the fair market value that is determined by local assessors to be the total taxable value of land and additions on the property. | Land | Improvement |
|---|---|---|---|---|
| 2025 | $2,939 | $385,000 | $100,000 | $285,000 |
| 2024 | $2,939 | $385,000 | $100,000 | $285,000 |
| 2023 | $2,698 | $385,000 | $100,000 | $285,000 |
| 2022 | $2,342 | $254,000 | $70,000 | $184,000 |
| 2021 | $2,325 | $254,000 | $70,000 | $184,000 |
| 2020 | $2,300 | $254,000 | $70,000 | $184,000 |
| 2019 | $2,294 | $254,000 | $70,000 | $184,000 |
| 2018 | $2,428 | $205,300 | $50,000 | $155,300 |
| 2017 | $2,397 | $205,300 | $50,000 | $155,300 |
| 2016 | $2,393 | $205,300 | $50,000 | $155,300 |
| 2015 | $2,390 | $205,300 | $50,000 | $155,300 |
| 2014 | $2,388 | $0 | $0 | $0 |
Source: Public Records
Map
Nearby Homes
- 9224 Agnes Park Ln
- 9221 Old Barnette Place
- 9003 Maple Hill Ct
- 12610 Angel Oak Dr
- 00 Stratton Farm Rd
- 12415 Bluff Meadow Trail
- 13513 Old Store Rd
- 6412, 6512 & 6520 Gilead Rd
- 8909 Abberley Ct
- 9000 Stourbridge Dr
- 14418 Laurel Tree Ln
- 9341 Stawell Dr
- 13016 Meadowmere Rd
- 14803 Middlethorpe Ln
- Atwater Plan at Overbrook Estates - Elmspring Collection
- Beckham II Plan at Overbrook Estates - Dogwood Collection
- Ashdale Plan at Overbrook Estates - Ashleaf Collection
- Nora II Plan at Overbrook Estates - Ashleaf Collection
- Woodrow II Plan at Overbrook Estates - Dogwood Collection
- Seaforth Plan at Overbrook Estates - Dogwood Collection
- 9123 Torrence Crossing Dr
- 9109 Torrence Crossing Dr
- 9118 Torrence Crossing Dr
- 9103 Torrence Crossing Dr
- 9112 Torrence Crossing Dr
- 9124 Torrence Crossing Dr
- 9106 Torrence Crossing Dr
- 9201 Torrence Crossing Dr
- 9035 Torrence Crossing Dr
- 9100 Torrence Crossing Dr
- 9200 Torrence Crossing Dr
- 9036 Torrence Crossing Dr
- 9123 Bertram Ct
- 9127 Bertram Ct
- 9209 Torrence Crossing Dr
- 9003 Torrence Crossing Dr
- 9135 Bertram Ct
- 9117 Bertram Ct
- 9208 Torrence Crossing Dr
- 12908 Bradford Hill Ln