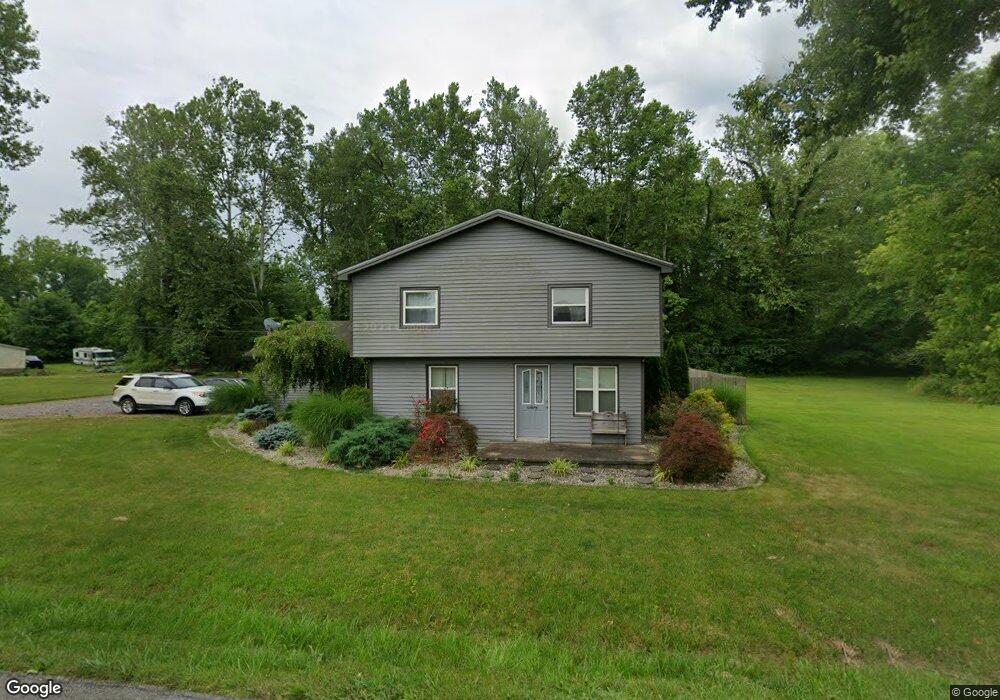
9115 W Base Rd Seymour, IN 47274
Estimated Value: $206,868 - $304,000
3
Beds
2
Baths
1,517
Sq Ft
$163/Sq Ft
Est. Value
About This Home
This home is located at 9115 W Base Rd, Seymour, IN 47274 and is currently estimated at $247,967, approximately $163 per square foot. 9115 W Base Rd is a home located in Jennings County with nearby schools including Hayden Elementary School, Jennings County Middle School, and Jennings County High School.
Ownership History
Date
Name
Owned For
Owner Type
Purchase Details
Closed on
Oct 19, 2015
Sold by
Burton Larry M
Bought by
Mellencamp Travis S
Current Estimated Value
Home Financials for this Owner
Home Financials are based on the most recent Mortgage that was taken out on this home.
Original Mortgage
$123,406
Outstanding Balance
$87,813
Interest Rate
3.87%
Mortgage Type
Purchase Money Mortgage
Estimated Equity
$160,154
Purchase Details
Closed on
Feb 1, 2013
Sold by
Mason Harold and Mason Kelly
Bought by
Mellencamp Travis S
Purchase Details
Closed on
Aug 15, 2008
Sold by
Beineke Timothy L
Bought by
Mellencamp Travis S
Home Financials for this Owner
Home Financials are based on the most recent Mortgage that was taken out on this home.
Original Mortgage
$90,355
Interest Rate
6.39%
Mortgage Type
FHA
Purchase Details
Closed on
Apr 2, 2003
Sold by
Homeq Servicing Corporation
Bought by
Beineke Timothy L
Purchase Details
Closed on
Jan 17, 2003
Sold by
Bailey Troy I
Bought by
Homeq Servicing Corporation
Create a Home Valuation Report for This Property
The Home Valuation Report is an in-depth analysis detailing your home's value as well as a comparison with similar homes in the area
Home Values in the Area
Average Home Value in this Area
Purchase History
| Date | Buyer | Sale Price | Title Company |
|---|---|---|---|
| Mellencamp Travis S | -- | None Available | |
| Mellencamp Travis S | -- | None Available | |
| Mellencamp Travis S | $92,000 | North Vernon Abstract Co Inc | |
| Mellencamp Travis S | -- | None Available | |
| Beineke Timothy L | $19,250 | -- | |
| Homeq Servicing Corporation | -- | -- |
Source: Public Records
Mortgage History
| Date | Status | Borrower | Loan Amount |
|---|---|---|---|
| Open | Mellencamp Travis S | $123,406 | |
| Previous Owner | Mellencamp Travis S | $90,355 |
Source: Public Records
Tax History Compared to Growth
Tax History
| Year | Tax Paid | Tax Assessment Tax Assessment Total Assessment is a certain percentage of the fair market value that is determined by local assessors to be the total taxable value of land and additions on the property. | Land | Improvement |
|---|---|---|---|---|
| 2024 | $815 | $122,100 | $15,000 | $107,100 |
| 2023 | $813 | $123,900 | $15,000 | $108,900 |
| 2022 | $594 | $96,900 | $15,000 | $81,900 |
| 2021 | $479 | $82,800 | $15,000 | $67,800 |
| 2020 | $501 | $84,900 | $15,000 | $69,900 |
| 2019 | $431 | $79,700 | $15,000 | $64,700 |
| 2018 | $414 | $79,700 | $15,000 | $64,700 |
| 2017 | $375 | $76,900 | $15,000 | $61,900 |
| 2016 | $312 | $76,900 | $15,000 | $61,900 |
| 2014 | $343 | $79,900 | $15,000 | $64,900 |
| 2013 | $372 | $79,900 | $15,000 | $64,900 |
Source: Public Records
Map
Nearby Homes
- 885 S Norkay St
- 12649 E Us Highway 50
- 12407 U S 50
- 30 S County Road 700 W
- 12969 E County Road 900 N
- 420 Private Road 690 W
- 355 N County Road 650 W
- 6530 W US Highway 50
- 6460 W Us Highway 50
- 6305 W Hickory Hill Dr
- 1200 S County Road 650 W
- 7000 N Block Us Hwy 31
- 10840 E Heywood Dr
- 10351 County Road 800 N
- Tract A on 3000 Bloc N County Road 1040 E
- 1123 Mockingbird Ln
- 4734 S Cloverleaf Dr
- 8955 N County Road 925 E
- 10413 Emerald Ct N
- 10409 Emerald Ct N
- 9160 W Base Rd
- 9040 W Base Rd
- 85 S County Road 900 W
- 9285 W Base Rd
- 9240 W Base Rd
- 9200 W Base Rd
- 95 N County Road 900 W
- 50 N County Road 900 W
- 9320 W Base Rd
- 165 N County Road 900 W
- 9375 W Base Rd
- 225 S County Road 900 W
- 185 N County Road 900 W
- 9400 W Base Rd
- 9400 W Base Rd
- 9350 W Base Rd
- 245 N County Road 900 W
- 240 N County Road 900 W
- 325 S County Road 900 W
- 345 S County Road 900 W