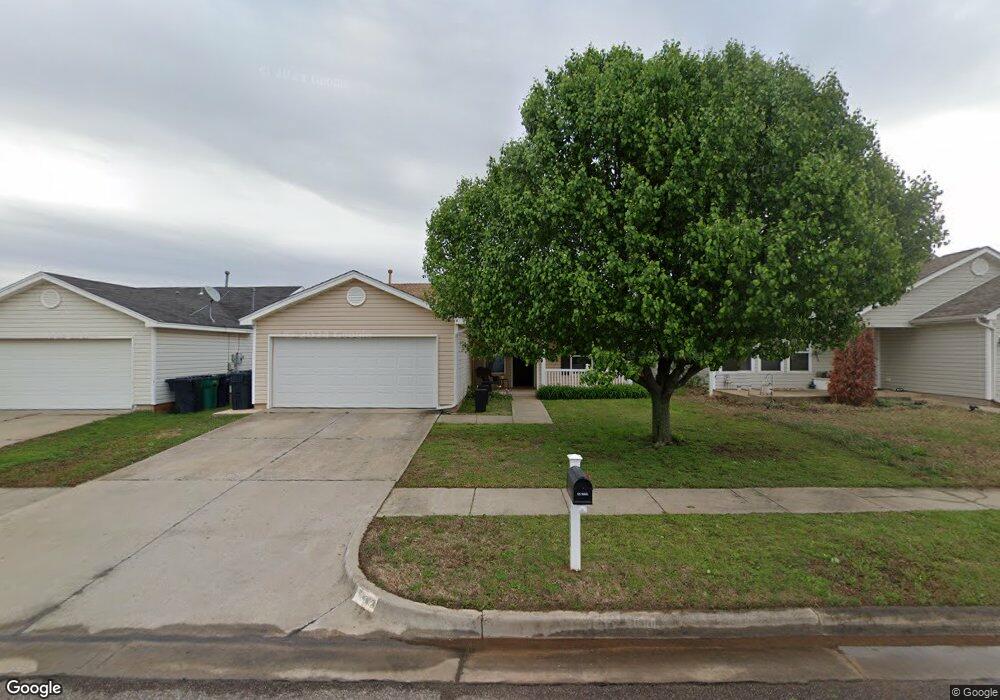
9116 Checkerbloom Dr Oklahoma City, OK 73165
Estimated Value: $196,461 - $206,000
3
Beds
2
Baths
1,329
Sq Ft
$152/Sq Ft
Est. Value
About This Home
This home is located at 9116 Checkerbloom Dr, Oklahoma City, OK 73165 and is currently estimated at $201,615, approximately $151 per square foot. 9116 Checkerbloom Dr is a home located in Cleveland County with nearby schools including Sooner Elementary School, Central Junior High School, and Moore High School.
Ownership History
Date
Name
Owned For
Owner Type
Purchase Details
Closed on
Dec 4, 2012
Sold by
Membardt Jason B and Membardt Melame D
Bought by
King John M and King Melea C
Current Estimated Value
Home Financials for this Owner
Home Financials are based on the most recent Mortgage that was taken out on this home.
Original Mortgage
$111,443
Outstanding Balance
$77,357
Interest Rate
3.41%
Mortgage Type
FHA
Estimated Equity
$124,258
Purchase Details
Closed on
Feb 15, 2006
Sold by
Green Gregory and Green Melissa
Bought by
Meinhardt Jason B and Meinhardt Melaine D
Home Financials for this Owner
Home Financials are based on the most recent Mortgage that was taken out on this home.
Original Mortgage
$105,248
Interest Rate
6.19%
Mortgage Type
FHA
Purchase Details
Closed on
Jun 26, 2003
Sold by
Ideal Homes Of Norman, Lp
Bought by
Green Gregory
Purchase Details
Closed on
Aug 30, 2002
Sold by
Vero Investments, Llc
Bought by
Ideal Homes Of Norman, Lp
Create a Home Valuation Report for This Property
The Home Valuation Report is an in-depth analysis detailing your home's value as well as a comparison with similar homes in the area
Home Values in the Area
Average Home Value in this Area
Purchase History
| Date | Buyer | Sale Price | Title Company |
|---|---|---|---|
| King John M | $113,500 | Stewart Abstract & Title Of | |
| Meinhardt Jason B | $107,000 | None Available | |
| Green Gregory | $99,000 | -- | |
| Ideal Homes Of Norman, Lp | $16,000 | -- |
Source: Public Records
Mortgage History
| Date | Status | Borrower | Loan Amount |
|---|---|---|---|
| Open | King John M | $111,443 | |
| Previous Owner | Meinhardt Jason B | $105,248 |
Source: Public Records
Tax History Compared to Growth
Tax History
| Year | Tax Paid | Tax Assessment Tax Assessment Total Assessment is a certain percentage of the fair market value that is determined by local assessors to be the total taxable value of land and additions on the property. | Land | Improvement |
|---|---|---|---|---|
| 2024 | $1,753 | $15,410 | $3,107 | $12,303 |
| 2023 | $1,707 | $14,961 | $3,275 | $11,686 |
| 2022 | $1,675 | $14,525 | $2,839 | $11,686 |
| 2021 | $1,619 | $14,102 | $3,180 | $10,922 |
| 2020 | $1,575 | $13,692 | $1,740 | $11,952 |
| 2019 | $1,593 | $13,692 | $1,740 | $11,952 |
| 2018 | $1,611 | $13,692 | $1,740 | $11,952 |
| 2017 | $1,739 | $13,692 | $0 | $0 |
| 2016 | $917 | $7,144 | $1,740 | $5,404 |
| 2015 | $1,514 | $12,767 | $1,740 | $11,027 |
| 2014 | $1,469 | $12,179 | $1,740 | $10,439 |
Source: Public Records
Map
Nearby Homes
- 9233 Snowberry Dr
- 9416 Checkerbloom Dr
- 8709 Woodbend Dr
- 5308 SE 88th St
- 8701 Woodbend Dr
- 4900 SE 88th Terrace
- 5308 SE 87th St
- 5105 SE 86th St
- 5401 SE 86th St
- 5305 SE 85th St
- 4836 SE 85th Terrace
- 8512 Bigwood Dr
- 8404 Pinewood Dr
- 8401 Azurewood Dr
- 8708 Lilly Ln
- 5009 SE 83rd Place
- 5717 SE 86th St
- 5725 SE 86th St
- 4313 SE 86th St
- 4708 SE 81st St
- 9120 Checkerbloom Dr
- 9200 Checkerbloom Dr
- 9108 Checkerbloom Dr
- 9204 Checkerbloom Dr
- 9117 Snowberry Dr
- 9104 Checkerbloom Dr
- 9121 Snowberry Dr
- 9113 Snowberry Dr
- 9208 Checkerbloom Dr
- 9109 Snowberry Dr
- 9201 Checkerbloom Dr
- 9201 Snowberry Dr
- 9121 Checkerbloom Dr
- 9113 Checkerbloom Dr
- 9212 Checkerbloom Dr
- 9100 Checkerbloom Dr
- 9109 Checkerbloom Dr
- 9105 Snowberry Dr
- 9205 Checkerbloom Dr
- 9205 Snowberry Dr