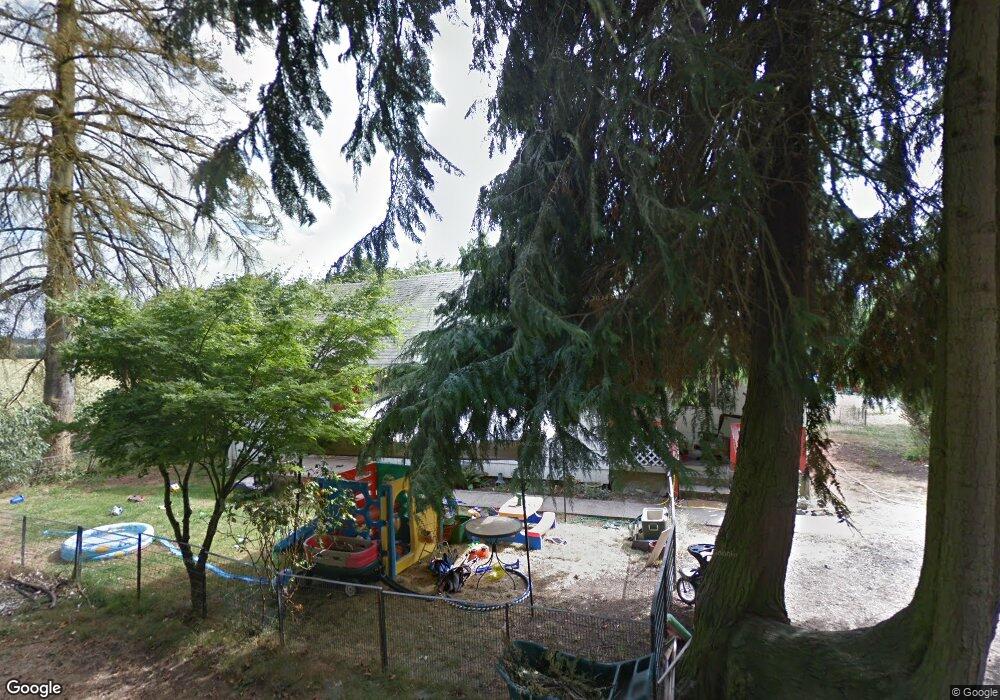
91193 N Skinner St Eugene, OR 97408
Coburg NeighborhoodEstimated Value: $339,000 - $441,939
2
Beds
1
Bath
1,272
Sq Ft
$294/Sq Ft
Est. Value
About This Home
This home is located at 91193 N Skinner St, Eugene, OR 97408 and is currently estimated at $373,985, approximately $294 per square foot. 91193 N Skinner St is a home located in Lane County with nearby schools including Gilham Elementary School, Cal Young Middle School, and Sheldon High School.
Ownership History
Date
Name
Owned For
Owner Type
Purchase Details
Closed on
Nov 12, 2015
Sold by
Noland Anna Jill
Bought by
Wigget Joshua T and Wigget Summer A
Current Estimated Value
Home Financials for this Owner
Home Financials are based on the most recent Mortgage that was taken out on this home.
Original Mortgage
$133,676
Outstanding Balance
$104,889
Interest Rate
3.8%
Mortgage Type
New Conventional
Estimated Equity
$269,097
Purchase Details
Closed on
Sep 8, 2004
Sold by
Foglesong Otis B and Foglesong Marquitta
Bought by
Wilson Daniel E and Wilson Kristine S
Home Financials for this Owner
Home Financials are based on the most recent Mortgage that was taken out on this home.
Original Mortgage
$89,900
Interest Rate
6.06%
Mortgage Type
Seller Take Back
Purchase Details
Closed on
Sep 24, 2003
Sold by
Flanders Jo Anne and Jo Anne Flanders Trust
Bought by
Noland Anna Jill
Home Financials for this Owner
Home Financials are based on the most recent Mortgage that was taken out on this home.
Original Mortgage
$95,200
Interest Rate
6.14%
Mortgage Type
Purchase Money Mortgage
Create a Home Valuation Report for This Property
The Home Valuation Report is an in-depth analysis detailing your home's value as well as a comparison with similar homes in the area
Home Values in the Area
Average Home Value in this Area
Purchase History
| Date | Buyer | Sale Price | Title Company |
|---|---|---|---|
| Wigget Joshua T | $130,000 | Cascade Title Company | |
| Wilson Daniel E | $149,900 | American Title Group | |
| Noland Anna Jill | $119,000 | Fidelity National Title Insu |
Source: Public Records
Mortgage History
| Date | Status | Borrower | Loan Amount |
|---|---|---|---|
| Open | Wigget Joshua T | $133,676 | |
| Previous Owner | Wilson Daniel E | $89,900 | |
| Previous Owner | Noland Anna Jill | $95,200 |
Source: Public Records
Tax History Compared to Growth
Tax History
| Year | Tax Paid | Tax Assessment Tax Assessment Total Assessment is a certain percentage of the fair market value that is determined by local assessors to be the total taxable value of land and additions on the property. | Land | Improvement |
|---|---|---|---|---|
| 2025 | $2,200 | $133,081 | -- | -- |
| 2024 | $2,177 | $129,205 | -- | -- |
| 2023 | $2,177 | $125,442 | $0 | $0 |
| 2022 | $2,047 | $121,789 | $0 | $0 |
| 2021 | $1,903 | $118,242 | $0 | $0 |
| 2020 | $1,925 | $114,799 | $0 | $0 |
| 2019 | $1,857 | $111,456 | $0 | $0 |
| 2018 | $1,732 | $105,058 | $0 | $0 |
| 2017 | $1,662 | $105,058 | $0 | $0 |
| 2016 | $1,615 | $101,998 | $0 | $0 |
| 2015 | $1,576 | $99,027 | $0 | $0 |
| 2014 | $1,506 | $96,143 | $0 | $0 |
Source: Public Records
Map
Nearby Homes
- 91185 N Coleman St
- 91247 N Willamette St
- 32633 W Mckenzie St
- 32781 E Pearl St
- 91052 S Willamette St Unit 12
- 91052 S Willamette (#12) St Unit 12
- 91033 Water St
- 32789 E Thomas St
- 90611 Coburg Rd
- 32062 Peppermint Ln
- 0 Diamond Ridge Loop Unit 712962163
- 91298 Oak Crest Rd
- 00 Coburg Rd
- 90849 Coburghills Dr
- 3950 Coburg Rd Unit 81
- 3950 Coburg Rd Unit 27
- 2181 Turning Oak Place
- 2138 Country Haven Dr
- 1930 Sterling Park Place
- 3708 Gilham Rd
- 91187 N Skinner St
- 91181 N Skinner St
- 32748 Coburg Creek Rd
- 91188 N Skinner St
- 32752 Coburg Creek Rd
- 91180 N Skinner St
- 91173 N Skinner St
- 32703 E Locust St
- 32696 E van Duyn St
- 91165 N Skinner St
- 91207 Coburg Creek Rd
- 91175 N Emerald St
- 32695 E Locust St
- 91168 N Emerald St
- 32688 E van Duyn St
- 32764 Coburg Rd
- 91163 N Diamond St
- 32751 Coburg Creek Rd
- 32687 E Locust St
- 91203 Coburg Creek Rd