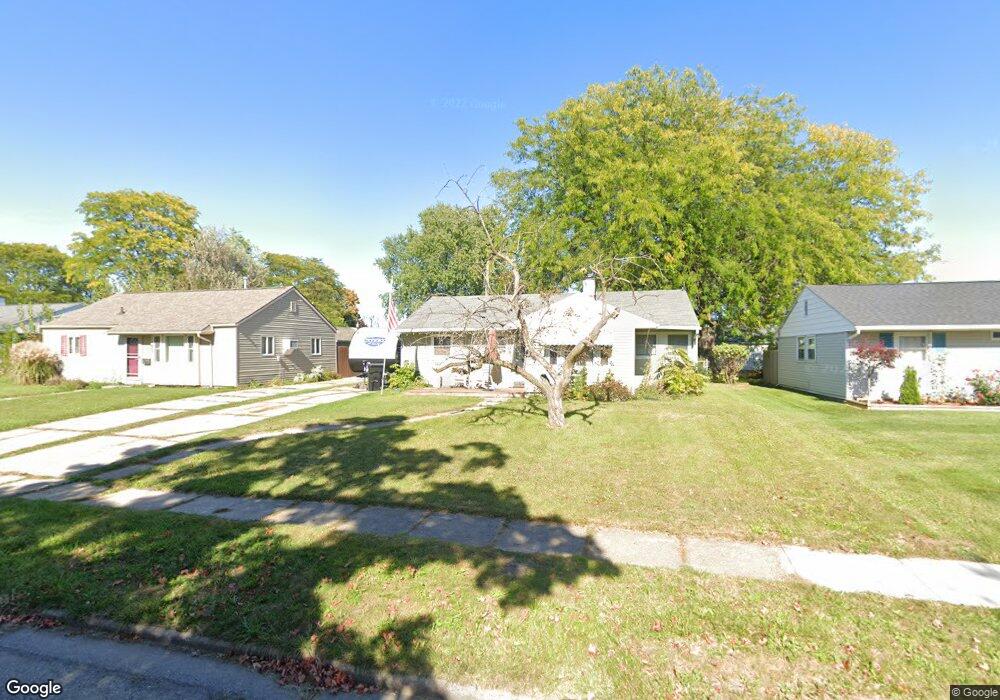
912 Andrus Ave Lansing, MI 48917
Edgemont Park NeighborhoodEstimated Value: $140,629 - $171,000
2
Beds
1
Bath
1,096
Sq Ft
$146/Sq Ft
Est. Value
About This Home
This home is located at 912 Andrus Ave, Lansing, MI 48917 and is currently estimated at $160,407, approximately $146 per square foot. 912 Andrus Ave is a home located in Ingham County with nearby schools including Waverly Senior High School, Windemere Park Charter Academy, and St. Gerard Elementary School.
Ownership History
Date
Name
Owned For
Owner Type
Purchase Details
Closed on
Mar 17, 2017
Sold by
Fedewa Jacquelynn M
Bought by
Fedewa Michael C
Current Estimated Value
Purchase Details
Closed on
May 6, 2005
Sold by
Fritzsche Lisa M
Bought by
Fedewa Michael C and Fedewa Jacquelyn M
Home Financials for this Owner
Home Financials are based on the most recent Mortgage that was taken out on this home.
Original Mortgage
$104,849
Outstanding Balance
$55,474
Interest Rate
6.07%
Mortgage Type
VA
Estimated Equity
$104,933
Purchase Details
Closed on
Jul 18, 2001
Sold by
White Mary I
Bought by
Fritzsche Lisa M
Home Financials for this Owner
Home Financials are based on the most recent Mortgage that was taken out on this home.
Original Mortgage
$71,200
Interest Rate
7.15%
Mortgage Type
Purchase Money Mortgage
Purchase Details
Closed on
Nov 5, 1998
Sold by
White Charles C
Bought by
White Mary I and Vlahakis James L
Create a Home Valuation Report for This Property
The Home Valuation Report is an in-depth analysis detailing your home's value as well as a comparison with similar homes in the area
Home Values in the Area
Average Home Value in this Area
Purchase History
| Date | Buyer | Sale Price | Title Company |
|---|---|---|---|
| Fedewa Michael C | -- | None Available | |
| Fedewa Michael C | $101,500 | Tnt | |
| Fritzsche Lisa M | $89,000 | -- | |
| White Mary I | -- | First American Title Ins Co |
Source: Public Records
Mortgage History
| Date | Status | Borrower | Loan Amount |
|---|---|---|---|
| Open | Fedewa Michael C | $104,849 | |
| Previous Owner | Fritzsche Lisa M | $71,200 |
Source: Public Records
Tax History Compared to Growth
Tax History
| Year | Tax Paid | Tax Assessment Tax Assessment Total Assessment is a certain percentage of the fair market value that is determined by local assessors to be the total taxable value of land and additions on the property. | Land | Improvement |
|---|---|---|---|---|
| 2025 | $2,153 | $62,100 | $20,800 | $41,300 |
| 2024 | $10 | $58,100 | $17,700 | $40,400 |
| 2023 | $2,094 | $53,500 | $17,500 | $36,000 |
| 2022 | $2,006 | $48,700 | $16,600 | $32,100 |
| 2021 | $2,024 | $46,300 | $13,900 | $32,400 |
| 2020 | $1,878 | $43,800 | $13,900 | $29,900 |
| 2019 | $1,829 | $39,700 | $9,700 | $30,000 |
| 2018 | $1,814 | $35,500 | $8,600 | $26,900 |
| 2017 | $1,715 | $35,500 | $8,600 | $26,900 |
| 2016 | -- | $34,100 | $8,000 | $26,100 |
| 2015 | -- | $34,000 | $16,082 | $17,918 |
| 2014 | -- | $29,800 | $13,864 | $15,936 |
Source: Public Records
Map
Nearby Homes
- 3435 Hagan St
- 1222 Ravenswood Dr
- 3333 W Willow St
- 3316 W Willow St
- 3322 Pickwick Place
- 3014 Timber Dr
- 3001 Risley Dr
- 3502 Springbrook Ln
- 1610 Ravenswood Dr
- 1920 Briarwood Dr
- 0000 N Dibble Ave
- 2817 W Willow St
- 4120 Arlene Dr
- 515 N Grace St
- 1805 Boynton Dr
- 240 N Deerfield Ave
- 3707 W Michigan Ave
- 531 Harriet Ave
- 205 Renker Rd
- 117 S Grace St