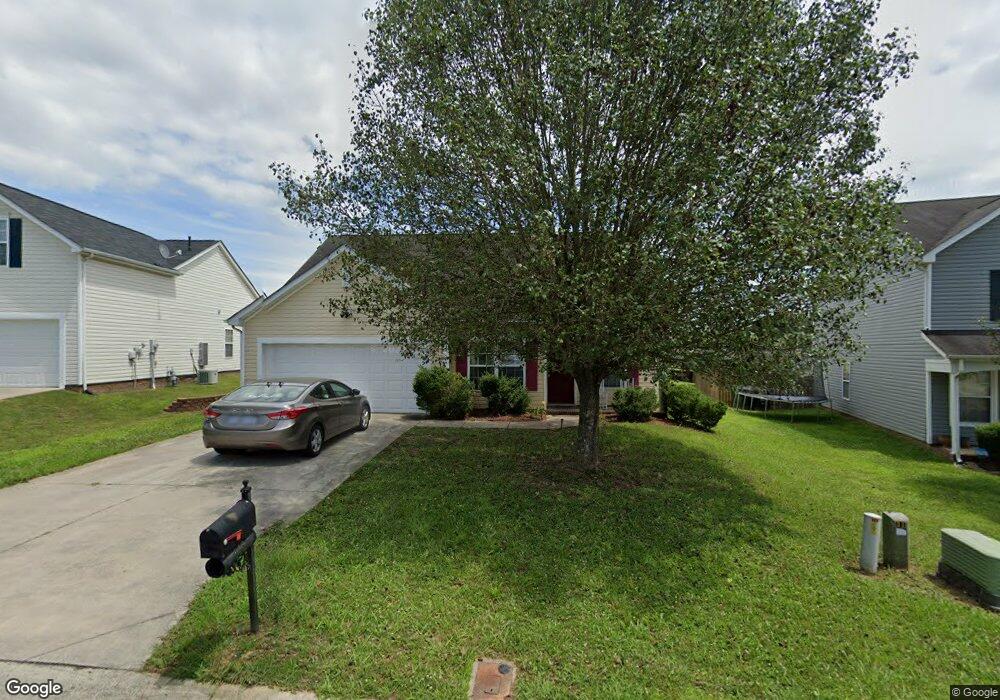
912 Back Bay Ct NE Kannapolis, NC 28083
Estimated Value: $265,000 - $306,000
3
Beds
2
Baths
1,188
Sq Ft
$240/Sq Ft
Est. Value
About This Home
This home is located at 912 Back Bay Ct NE, Kannapolis, NC 28083 and is currently estimated at $285,171, approximately $240 per square foot. 912 Back Bay Ct NE is a home located in Cabarrus County with nearby schools including Forest Park Elementary School, Kannapolis Middle, and A.L. Brown High School.
Ownership History
Date
Name
Owned For
Owner Type
Purchase Details
Closed on
Jul 2, 2021
Sold by
Meletis Vivian and Peter T Meletis Living Trust
Bought by
Meletis Scott Properties Llc
Current Estimated Value
Home Financials for this Owner
Home Financials are based on the most recent Mortgage that was taken out on this home.
Original Mortgage
$160,000
Outstanding Balance
$98,911
Interest Rate
2.9%
Mortgage Type
Purchase Money Mortgage
Estimated Equity
$186,260
Purchase Details
Closed on
Dec 8, 2006
Sold by
Dlj Mortgage Capital Inc
Bought by
Peter T Meletis Living Trust
Purchase Details
Closed on
Jun 19, 2006
Sold by
Coats Dwight L
Bought by
Dlj Mortgage Capital Inc
Purchase Details
Closed on
Jul 20, 2005
Sold by
Gb Homebuilders Llc
Bought by
Coats Dwight L
Home Financials for this Owner
Home Financials are based on the most recent Mortgage that was taken out on this home.
Original Mortgage
$99,200
Interest Rate
5.46%
Mortgage Type
Fannie Mae Freddie Mac
Create a Home Valuation Report for This Property
The Home Valuation Report is an in-depth analysis detailing your home's value as well as a comparison with similar homes in the area
Home Values in the Area
Average Home Value in this Area
Purchase History
| Date | Buyer | Sale Price | Title Company |
|---|---|---|---|
| Meletis Scott Properties Llc | $165,000 | Investors Title Co | |
| Peter T Meletis Living Trust | $113,000 | None Available | |
| Dlj Mortgage Capital Inc | $107,058 | None Available | |
| Coats Dwight L | $124,500 | -- |
Source: Public Records
Mortgage History
| Date | Status | Borrower | Loan Amount |
|---|---|---|---|
| Open | Meletis Scott Properties Llc | $160,000 | |
| Previous Owner | Coats Dwight L | $99,200 | |
| Closed | Coats Dwight L | $24,800 |
Source: Public Records
Tax History Compared to Growth
Tax History
| Year | Tax Paid | Tax Assessment Tax Assessment Total Assessment is a certain percentage of the fair market value that is determined by local assessors to be the total taxable value of land and additions on the property. | Land | Improvement |
|---|---|---|---|---|
| 2025 | $2,821 | $283,190 | $59,000 | $224,190 |
| 2024 | $2,821 | $283,190 | $59,000 | $224,190 |
| 2023 | $1,852 | $151,790 | $35,000 | $116,790 |
| 2022 | $1,852 | $151,790 | $35,000 | $116,790 |
| 2021 | $1,852 | $151,790 | $35,000 | $116,790 |
| 2020 | $1,852 | $151,790 | $35,000 | $116,790 |
| 2019 | $1,272 | $104,300 | $19,000 | $85,300 |
| 2018 | $1,252 | $104,300 | $19,000 | $85,300 |
| 2017 | $1,231 | $104,300 | $19,000 | $85,300 |
| 2016 | $730 | $114,150 | $24,000 | $90,150 |
| 2015 | $1,347 | $114,150 | $24,000 | $90,150 |
| 2014 | $1,347 | $114,150 | $24,000 | $90,150 |
Source: Public Records
Map
Nearby Homes
- 915 Harbour View Cove NE
- 925 Anchor Way NE
- 839 Anchor Way NE
- 4750 J W Cline Rd
- 2495 Centergrove Rd
- 2405 Forrestbrook Dr
- 2416 Forrestbrook Dr
- 2882 Centergrove Rd
- 2245 Heritage Ct Unit 2
- 2458 Saguaro Ln
- 2485 Acadia Ct
- 2990 Dale Earnhardt Blvd
- 3007 Centergrove Rd
- 14 Knowles St
- 252 Forest Pond Rd
- 512 Villa St
- 00 Dixie Dr
- 4849 Samuel Richard St
- 5100 Patterson Rd
- 1699 Mission Oaks St
- 908 Back Bay Ct NE
- 918 Back Bay Ct NE
- 2634 Lookout Point Rd
- 2634 Lookout Point NE
- 922 Back Bay Ct NE
- 904 Back Bay Ct NE
- 904 Back Bay Ct NE Unit 155
- 2630 Lookout Point Rd
- 2647 Captains Watch
- 2626 Lookout Point Rd
- 909 Back Bay Ct NE
- 2651 Captains Watch
- 917 Back Bay Ct NE
- 926 Back Bay Ct NE
- 926 Back Bay Ct NE
- 926 Back Bay Ct NE Unit 150
- 905 Back Bay Ct NE
- 2622 Lookout Point Rd
- 921 Back Bay Ct NE
- 2655 Captains Watch