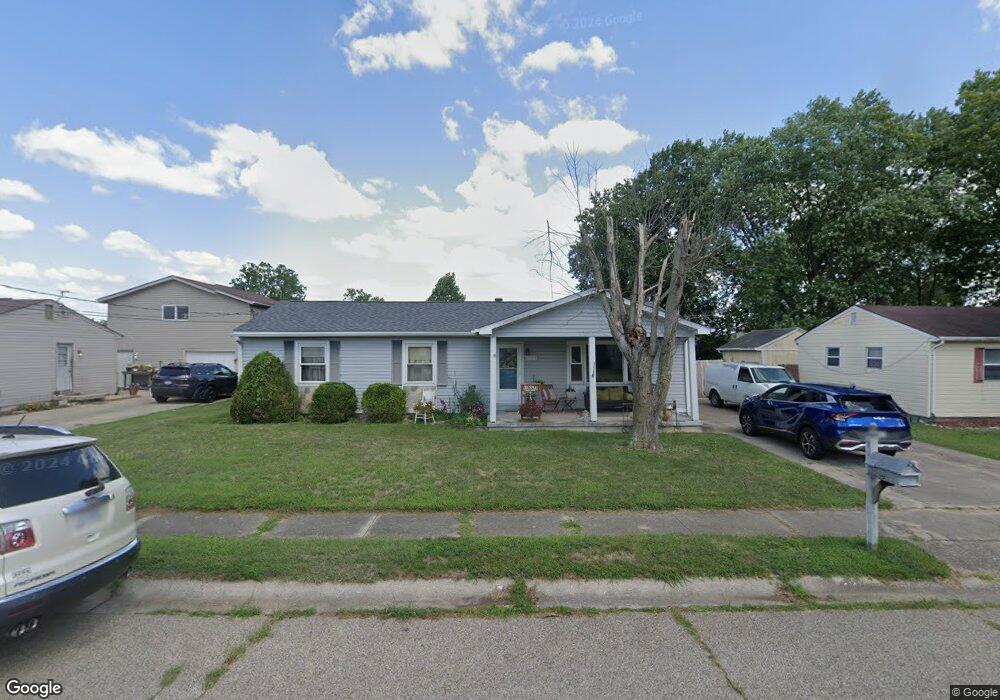
912 Charles St Trenton, OH 45067
Estimated Value: $216,508 - $255,000
3
Beds
2
Baths
1,674
Sq Ft
$143/Sq Ft
Est. Value
About This Home
This home is located at 912 Charles St, Trenton, OH 45067 and is currently estimated at $239,877, approximately $143 per square foot. 912 Charles St is a home located in Butler County with nearby schools including Edgewood Intermediate School and Edgewood High School.
Ownership History
Date
Name
Owned For
Owner Type
Purchase Details
Closed on
Mar 15, 1996
Sold by
Carder Carmine C
Bought by
Steed Larry D and Steed Melissa A
Current Estimated Value
Home Financials for this Owner
Home Financials are based on the most recent Mortgage that was taken out on this home.
Original Mortgage
$84,100
Outstanding Balance
$3,309
Interest Rate
7.06%
Mortgage Type
FHA
Estimated Equity
$236,568
Purchase Details
Closed on
Mar 14, 1995
Sold by
Lucas Christopher Howard
Bought by
Carder Carmine C
Home Financials for this Owner
Home Financials are based on the most recent Mortgage that was taken out on this home.
Original Mortgage
$74,029
Interest Rate
9.13%
Mortgage Type
FHA
Create a Home Valuation Report for This Property
The Home Valuation Report is an in-depth analysis detailing your home's value as well as a comparison with similar homes in the area
Home Values in the Area
Average Home Value in this Area
Purchase History
| Date | Buyer | Sale Price | Title Company |
|---|---|---|---|
| Steed Larry D | $84,000 | -- | |
| Carder Carmine C | $74,900 | -- |
Source: Public Records
Mortgage History
| Date | Status | Borrower | Loan Amount |
|---|---|---|---|
| Open | Steed Larry D | $84,100 | |
| Previous Owner | Carder Carmine C | $74,029 |
Source: Public Records
Tax History Compared to Growth
Tax History
| Year | Tax Paid | Tax Assessment Tax Assessment Total Assessment is a certain percentage of the fair market value that is determined by local assessors to be the total taxable value of land and additions on the property. | Land | Improvement |
|---|---|---|---|---|
| 2024 | $2,099 | $49,840 | $8,900 | $40,940 |
| 2023 | $2,090 | $49,130 | $8,900 | $40,230 |
| 2022 | $1,806 | $37,800 | $8,900 | $28,900 |
| 2021 | $1,736 | $37,800 | $8,900 | $28,900 |
| 2020 | $1,850 | $37,800 | $8,900 | $28,900 |
| 2019 | $1,983 | $34,560 | $9,230 | $25,330 |
| 2018 | $1,796 | $34,560 | $9,230 | $25,330 |
| 2017 | $1,797 | $34,560 | $9,230 | $25,330 |
| 2016 | $1,663 | $30,530 | $9,230 | $21,300 |
| 2015 | $1,415 | $30,530 | $9,230 | $21,300 |
| 2014 | $1,666 | $30,530 | $9,230 | $21,300 |
| 2013 | $1,666 | $33,600 | $9,230 | $24,370 |
Source: Public Records
Map
Nearby Homes