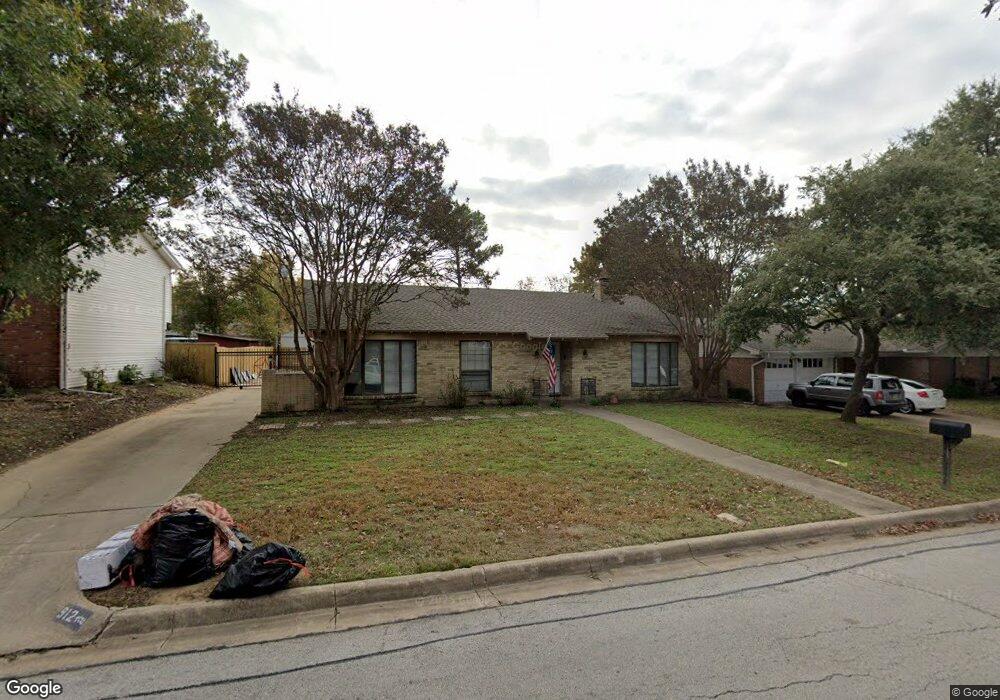
912 Charleston Dr Bedford, TX 76022
Estimated Value: $338,000
3
Beds
2
Baths
1,714
Sq Ft
$197/Sq Ft
Est. Value
About This Home
This home is located at 912 Charleston Dr, Bedford, TX 76022 and is currently estimated at $338,000, approximately $197 per square foot. 912 Charleston Dr is a home located in Tarrant County with nearby schools including Bell Manor Elementary School, Central J High School, and Trinity High School.
Ownership History
Date
Name
Owned For
Owner Type
Purchase Details
Closed on
Nov 19, 2018
Sold by
Cates Patricia
Bought by
Cates James Troy
Current Estimated Value
Purchase Details
Closed on
Feb 23, 2018
Sold by
Mcolin Ron
Bought by
Setae Properties Llc
Purchase Details
Closed on
Oct 24, 2017
Sold by
Toll Dallas Tx Llc
Bought by
Chennupati Anupama and Kandepu Ramesh
Home Financials for this Owner
Home Financials are based on the most recent Mortgage that was taken out on this home.
Original Mortgage
$816,500
Interest Rate
3.37%
Mortgage Type
Adjustable Rate Mortgage/ARM
Purchase Details
Closed on
Apr 27, 2012
Sold by
Howell Raymond L and Howell Chantal A
Bought by
Mcolin Ron
Home Financials for this Owner
Home Financials are based on the most recent Mortgage that was taken out on this home.
Original Mortgage
$106,000
Interest Rate
4.11%
Mortgage Type
New Conventional
Purchase Details
Closed on
Feb 28, 1994
Sold by
Cisneros Henry G
Bought by
Howell Raymond L and Howell Chantal A
Create a Home Valuation Report for This Property
The Home Valuation Report is an in-depth analysis detailing your home's value as well as a comparison with similar homes in the area
Home Values in the Area
Average Home Value in this Area
Purchase History
| Date | Buyer | Sale Price | Title Company |
|---|---|---|---|
| Cates James Troy | -- | None Available | |
| Setae Properties Llc | -- | None Available | |
| Chennupati Anupama | -- | None Available | |
| Mcolin Ron | -- | Federal Title Inc | |
| Howell Raymond L | -- | -- |
Source: Public Records
Mortgage History
| Date | Status | Borrower | Loan Amount |
|---|---|---|---|
| Previous Owner | Chennupati Anupama | $816,500 | |
| Previous Owner | Mcolin Ron | $106,000 |
Source: Public Records
Tax History Compared to Growth
Tax History
| Year | Tax Paid | Tax Assessment Tax Assessment Total Assessment is a certain percentage of the fair market value that is determined by local assessors to be the total taxable value of land and additions on the property. | Land | Improvement |
|---|---|---|---|---|
| 2025 | $6,182 | $317,508 | $65,000 | $252,508 |
| 2024 | $6,182 | $317,508 | $65,000 | $252,508 |
| 2023 | $5,708 | $297,623 | $45,000 | $252,623 |
| 2022 | $6,156 | $281,869 | $45,000 | $236,869 |
| 2021 | $5,183 | $220,040 | $45,000 | $175,040 |
| 2020 | $4,280 | $180,000 | $45,000 | $135,000 |
| 2019 | $4,373 | $180,000 | $45,000 | $135,000 |
| 2018 | $3,042 | $190,210 | $23,000 | $167,210 |
| 2017 | $4,228 | $174,787 | $23,000 | $151,787 |
| 2016 | $3,803 | $157,198 | $23,000 | $134,198 |
| 2015 | $3,340 | $133,000 | $18,000 | $115,000 |
| 2014 | $3,340 | $133,000 | $18,000 | $115,000 |
Source: Public Records
Map
Nearby Homes
- 804 Natchez Ave
- 952 Charleston Dr
- 933 Charleston Ct
- 1604 Richmond Dr
- 1613 Trinity Ct
- 2024 Charleston Dr
- 2101 Gettysburg Place
- 1701 Winchester Way
- 828 Gregory Ave
- 808 Gregory Ave
- 800 Prestwick St
- 1031 Boston Blvd
- 1216 Princeton Place
- 2201 Greendale Ct
- 2025 Schumac Ln
- 1049 Stableway Ln
- 1213 Greendale Dr
- 909 Overhill Dr
- 1004 Overhill Dr
- 921 Overhill Dr
- 908 Charleston Dr
- 916 Charleston Dr
- 905 Gettysburg Place
- 909 Gettysburg Place
- 920 Charleston Dr
- 904 Charleston Dr
- 901 Gettysburg Place
- 913 Gettysburg Place
- 909 Charleston Dr
- 913 Charleston Dr
- 905 Charleston Dr
- 917 Charleston Ct
- 900 Charleston Dr
- 940 Charleston Dr
- 825 Gettysburg Place
- 917 Gettysburg Place
- 901 Charleston Dr
- 921 Charleston Ct
- 944 Charleston Dr
- 820 Charleston Dr