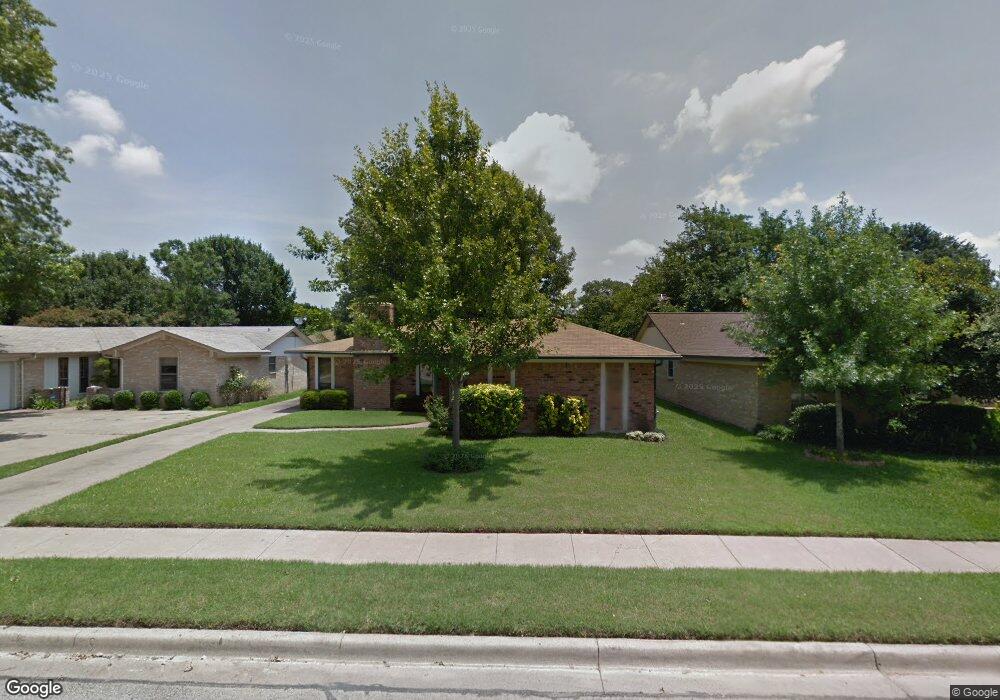
912 Columbus Ct Bedford, TX 76022
Estimated Value: $334,690 - $367,000
3
Beds
2
Baths
1,730
Sq Ft
$200/Sq Ft
Est. Value
About This Home
This home is located at 912 Columbus Ct, Bedford, TX 76022 and is currently estimated at $346,673, approximately $200 per square foot. 912 Columbus Ct is a home located in Tarrant County with nearby schools including Bell Manor Elementary School, Central J High School, and Trinity High School.
Ownership History
Date
Name
Owned For
Owner Type
Purchase Details
Closed on
Jan 22, 2025
Sold by
Reed Michael Ryan and Reed Jami Sue
Bought by
Reed Family Trust and Reed
Current Estimated Value
Purchase Details
Closed on
Aug 31, 2015
Sold by
Gauthier Mitchell R and Gauthier Nelida Rivera
Bought by
Reed Michael and Reed Jami
Home Financials for this Owner
Home Financials are based on the most recent Mortgage that was taken out on this home.
Original Mortgage
$151,905
Interest Rate
4.12%
Mortgage Type
New Conventional
Purchase Details
Closed on
Mar 19, 2014
Sold by
Graeve John W and Graeve Nancy A
Bought by
Gauthier Mitchell R and Gauthier Nelida Rivera
Home Financials for this Owner
Home Financials are based on the most recent Mortgage that was taken out on this home.
Original Mortgage
$110,175
Interest Rate
4.27%
Mortgage Type
New Conventional
Create a Home Valuation Report for This Property
The Home Valuation Report is an in-depth analysis detailing your home's value as well as a comparison with similar homes in the area
Home Values in the Area
Average Home Value in this Area
Purchase History
| Date | Buyer | Sale Price | Title Company |
|---|---|---|---|
| Reed Family Trust | -- | None Listed On Document | |
| Reed Michael | -- | None Available | |
| Gauthier Mitchell R | -- | Rtt |
Source: Public Records
Mortgage History
| Date | Status | Borrower | Loan Amount |
|---|---|---|---|
| Previous Owner | Reed Michael | $151,905 | |
| Previous Owner | Gauthier Mitchell R | $110,175 |
Source: Public Records
Tax History Compared to Growth
Tax History
| Year | Tax Paid | Tax Assessment Tax Assessment Total Assessment is a certain percentage of the fair market value that is determined by local assessors to be the total taxable value of land and additions on the property. | Land | Improvement |
|---|---|---|---|---|
| 2025 | $4,523 | $296,100 | $65,000 | $231,100 |
| 2024 | $4,523 | $296,100 | $65,000 | $231,100 |
| 2023 | $5,557 | $317,700 | $45,000 | $272,700 |
| 2022 | $5,356 | $249,180 | $45,000 | $204,180 |
| 2021 | $5,251 | $222,936 | $45,000 | $177,936 |
| 2020 | $5,419 | $227,936 | $45,000 | $182,936 |
| 2019 | $5,375 | $229,486 | $45,000 | $184,486 |
| 2018 | $4,504 | $201,136 | $18,000 | $183,136 |
| 2017 | $4,454 | $184,108 | $18,000 | $166,108 |
| 2016 | $4,084 | $168,836 | $18,000 | $150,836 |
| 2015 | $2,135 | $157,839 | $18,000 | $139,839 |
| 2014 | $2,135 | $138,300 | $18,000 | $120,300 |
Source: Public Records
Map
Nearby Homes
- 1613 Trinity Ct
- 1604 Richmond Dr
- 933 Charleston Ct
- 1031 Boston Blvd
- 904 Nelson Terrace
- 1701 Winchester Way
- 952 Charleston Dr
- 804 Natchez Ave
- 1004 Overhill Dr
- 921 Overhill Dr
- 909 Overhill Dr
- 2024 Charleston Dr
- 1204 Edgecliff Dr
- 2101 Gettysburg Place
- 2025 Schumac Ln
- 1509 Shirley Way
- 2201 Greendale Ct
- 828 Gregory Ave
- 808 Gregory Ave
- 1213 Briar Dr
- 916 Columbus Ct
- 908 Columbus Ct
- 920 Columbus Ct
- 904 Columbus Ct
- 913 Monterrey St
- 909 Monterrey St
- 917 Monterrey St
- 913 Columbus Ct
- 917 Columbus Ct
- 924 Columbus Ct
- 905 Monterrey St
- 900 Columbus Ct
- 909 Columbus Ct
- 921 Columbus Ct
- 1001 Monterrey St
- 901 Monterrey St
- 905 Columbus Ct
- 925 Columbus Ct
- 928 Columbus Ct
- 1005 Monterrey St