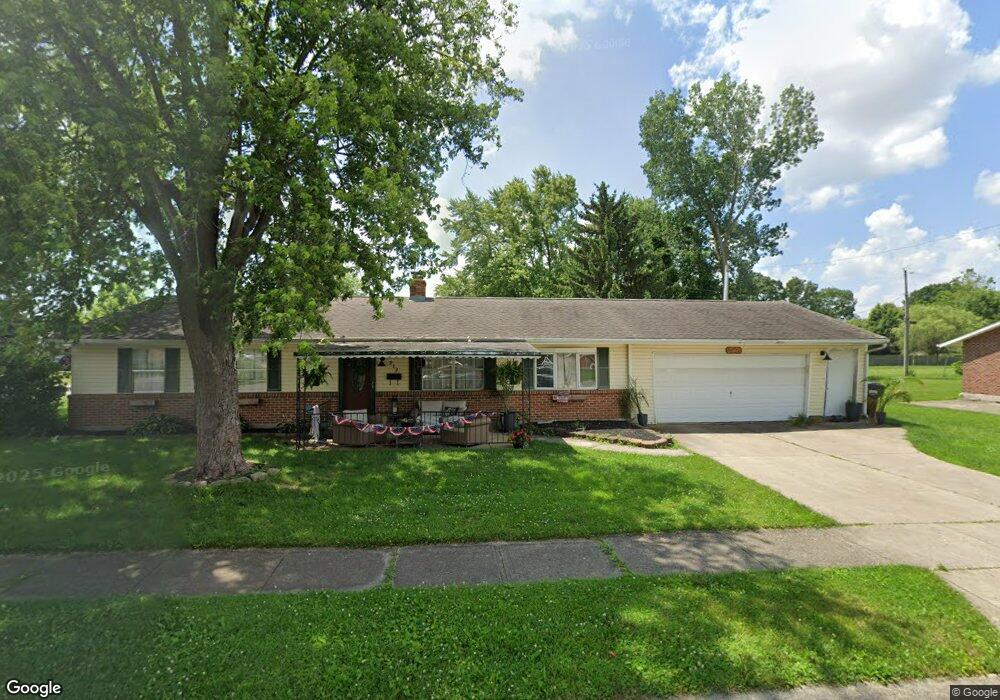
912 Columbus Hines Way New Lebanon, OH 45345
Estimated Value: $177,000 - $186,000
3
Beds
2
Baths
1,350
Sq Ft
$135/Sq Ft
Est. Value
About This Home
This home is located at 912 Columbus Hines Way, New Lebanon, OH 45345 and is currently estimated at $182,467, approximately $135 per square foot. 912 Columbus Hines Way is a home located in Montgomery County with nearby schools including Dixie Elementary School, Dixie Middle School, and Dixie High School.
Ownership History
Date
Name
Owned For
Owner Type
Purchase Details
Closed on
Apr 6, 2016
Sold by
Ventures Trust 2013 I H R
Bought by
Couch Author M and Couch Jana M
Current Estimated Value
Home Financials for this Owner
Home Financials are based on the most recent Mortgage that was taken out on this home.
Original Mortgage
$36,000
Outstanding Balance
$28,543
Interest Rate
3.62%
Mortgage Type
New Conventional
Estimated Equity
$153,924
Purchase Details
Closed on
Jun 30, 2015
Sold by
Citimortgage Inc
Bought by
Ventures Trust 2013-I H R
Purchase Details
Closed on
Mar 19, 2015
Sold by
Brandt Sandra M
Bought by
Citimortgage Inc
Purchase Details
Closed on
Sep 20, 1996
Sold by
Cox Kelly D and Leonard Kelly D
Bought by
Brandt Norbert J and Brandt Sandra M
Create a Home Valuation Report for This Property
The Home Valuation Report is an in-depth analysis detailing your home's value as well as a comparison with similar homes in the area
Home Values in the Area
Average Home Value in this Area
Purchase History
| Date | Buyer | Sale Price | Title Company |
|---|---|---|---|
| Couch Author M | $45,000 | Safemark Title Agency Inc | |
| Ventures Trust 2013-I H R | -- | Attorney | |
| Citimortgage Inc | $36,000 | None Available | |
| Brandt Norbert J | $73,500 | Lawyers Title Insurance Corp |
Source: Public Records
Mortgage History
| Date | Status | Borrower | Loan Amount |
|---|---|---|---|
| Open | Couch Author M | $36,000 |
Source: Public Records
Tax History Compared to Growth
Tax History
| Year | Tax Paid | Tax Assessment Tax Assessment Total Assessment is a certain percentage of the fair market value that is determined by local assessors to be the total taxable value of land and additions on the property. | Land | Improvement |
|---|---|---|---|---|
| 2024 | $2,564 | $44,090 | $8,630 | $35,460 |
| 2023 | $2,564 | $44,090 | $8,630 | $35,460 |
| 2022 | $2,421 | $32,190 | $6,300 | $25,890 |
| 2021 | $2,397 | $32,190 | $6,300 | $25,890 |
| 2020 | $2,345 | $32,190 | $6,300 | $25,890 |
| 2019 | $2,155 | $26,510 | $6,300 | $20,210 |
| 2018 | $2,162 | $26,510 | $6,300 | $20,210 |
| 2017 | $2,146 | $26,510 | $6,300 | $20,210 |
| 2016 | $2,046 | $26,510 | $6,300 | $20,210 |
| 2015 | $1,914 | $26,510 | $6,300 | $20,210 |
| 2014 | $1,914 | $26,510 | $6,300 | $20,210 |
| 2012 | -- | $33,480 | $6,300 | $27,180 |
Source: Public Records
Map
Nearby Homes
- 404 S Fuls Rd
- 731 Homeway Dr
- 432 Scarborough Ct
- 1200 W Main St
- 448 Gregory Ave
- 115 N Clayton Rd
- 452 Holderman Place
- 306 N Clayton Rd
- 224 Drina Ave
- 231 S Church St
- 107 Laredo Ave
- 0 Dayton Eaton Pike Unit 1834498
- 260 Yorkwood Dr
- 136 Bronwood St
- 13181 Dayton Eaton Pike Unit 13181
- 0 Eagle Rd
- 11941 Havermale Rd
- 13343 Dechant Rd
- 1179 Zehring Rd
- 1833 Guntle Rd
- 479 Shock Dr
- 922 Columbus Hines Way
- 911 Columbus Hines Way
- 485 Shock Dr
- 932 Columbus Hines Way
- 460 Shock Dr
- 470 Shock Dr
- 921 Columbus Hines Way
- 442 Shock Dr
- 401 Shock Dr
- 491 Shock Dr
- 412 Shock Dr
- 972 Columbus Hines Way
- 931 Columbus Hines Way
- 823 Shock Dr
- 397 Shock Dr
- 390 Shock Dr
- 331 Dorothy Ln
- 337 Dorothy Ln
- 971 Columbus Hines Way