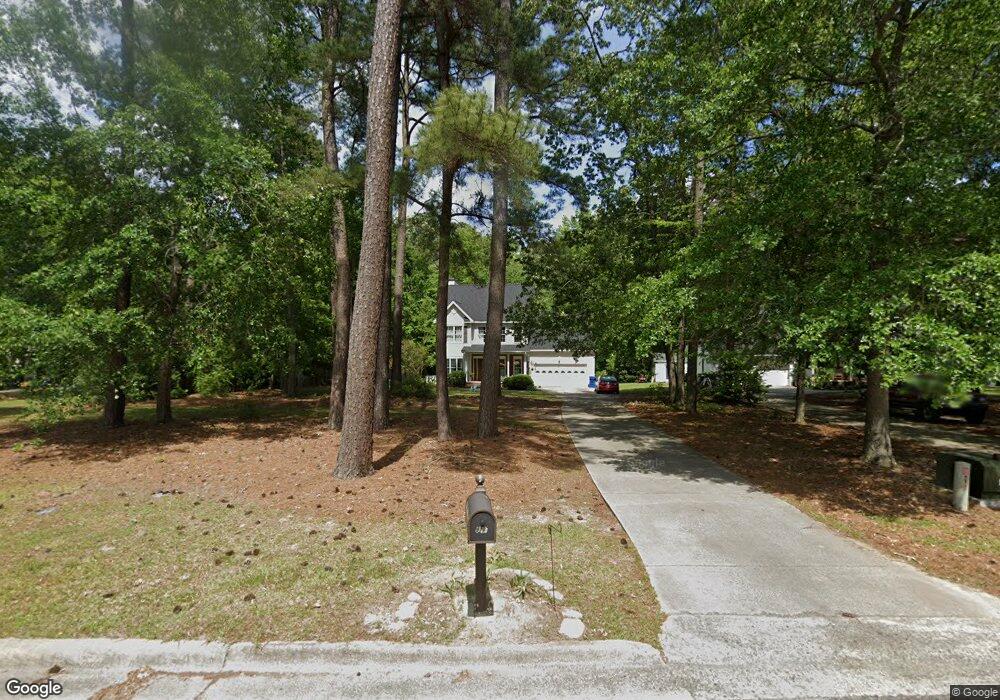
912 Corbett St Winterville, NC 28590
Estimated Value: $266,000 - $310,064
3
Beds
3
Baths
1,950
Sq Ft
$148/Sq Ft
Est. Value
About This Home
This home is located at 912 Corbett St, Winterville, NC 28590 and is currently estimated at $288,766, approximately $148 per square foot. 912 Corbett St is a home located in Pitt County with nearby schools including Wintergreen Primary School, Wintergreen Intermediate School, and A.G. Cox Middle School.
Ownership History
Date
Name
Owned For
Owner Type
Purchase Details
Closed on
Dec 16, 2022
Sold by
Passwater Michael E and Passwater Ellen V
Bought by
Graves John Steven and Sweet Abigail
Current Estimated Value
Home Financials for this Owner
Home Financials are based on the most recent Mortgage that was taken out on this home.
Original Mortgage
$259,256
Outstanding Balance
$250,797
Interest Rate
6.49%
Mortgage Type
FHA
Estimated Equity
$37,969
Purchase Details
Closed on
Jan 27, 2006
Sold by
Pavelich Kevin L and Pavelich Staci L
Bought by
Passwater Michael E and Passwater Ellen V
Home Financials for this Owner
Home Financials are based on the most recent Mortgage that was taken out on this home.
Original Mortgage
$152,500
Interest Rate
6.21%
Mortgage Type
Unknown
Create a Home Valuation Report for This Property
The Home Valuation Report is an in-depth analysis detailing your home's value as well as a comparison with similar homes in the area
Home Values in the Area
Average Home Value in this Area
Purchase History
| Date | Buyer | Sale Price | Title Company |
|---|---|---|---|
| Graves John Steven | $264,500 | -- | |
| Passwater Michael E | -- | None Available |
Source: Public Records
Mortgage History
| Date | Status | Borrower | Loan Amount |
|---|---|---|---|
| Open | Graves John Steven | $259,256 | |
| Previous Owner | Passwater Michael E | $152,500 |
Source: Public Records
Tax History Compared to Growth
Tax History
| Year | Tax Paid | Tax Assessment Tax Assessment Total Assessment is a certain percentage of the fair market value that is determined by local assessors to be the total taxable value of land and additions on the property. | Land | Improvement |
|---|---|---|---|---|
| 2025 | $1,795 | $263,837 | $40,000 | $223,837 |
| 2024 | $1,783 | $263,837 | $40,000 | $223,837 |
| 2023 | $1,539 | $191,761 | $35,000 | $156,761 |
| 2022 | $1,546 | $191,761 | $35,000 | $156,761 |
| 2021 | $1,539 | $191,761 | $35,000 | $156,761 |
| 2020 | $1,548 | $191,761 | $35,000 | $156,761 |
| 2019 | $1,511 | $184,989 | $35,000 | $149,989 |
| 2018 | $1,444 | $184,989 | $35,000 | $149,989 |
| 2017 | $1,444 | $184,989 | $35,000 | $149,989 |
| 2016 | $1,425 | $184,989 | $35,000 | $149,989 |
| 2015 | $1,346 | $175,611 | $36,000 | $139,611 |
| 2014 | $1,346 | $175,611 | $36,000 | $139,611 |
Source: Public Records
Map
Nearby Homes
- 2203 Franklin Dr
- 874 Corbett St
- 731 Winterfield Dr
- 763 Winterfield Dr
- 2243 Black Horse Ln
- 4695 Old Tar Rd
- 626 Winterfield Dr
- 626 Edenbrook Dr
- 1505 Trafalgar Rd
- 133 Blackwater Dr
- 561 Channel Dr
- Greystone Plan at Eli's Ridge
- Walden Plan at Eli's Ridge
- Haddock Plan at Eli's Ridge
- Halston Plan at Eli's Ridge
- Murdock Plan at Eli's Ridge
- Weaver Plan at Eli's Ridge
- Carson Plan at Eli's Ridge
- Camden Plan at Eli's Ridge
- Creekside Plan at Eli's Ridge
- 906 Corbett St
- 924 Corbett St
- 898 Corbett St
- 2215 Frankllin Dr
- 2215 Franklin Dr
- 2219 Franklin Dr
- 2209 Franklin Dr
- 2209 Edgewater Dr
- 2208 Edgewater Dr
- 888 Corbett St
- 2233 Franklin Dr
- 899 Corbett St
- 2220 Franklin Dr
- 882 Corbett St
- 2239 Franklin Dr
- 891 Corbett St
- 2220 Edgewater Dr
- 2221 Edgewater Dr
- 2197 Franklin Dr
- 2230 Franklin Dr