Estimated Value: $126,000 - $424,000
--
Bed
2
Baths
1,643
Sq Ft
$181/Sq Ft
Est. Value
About This Home
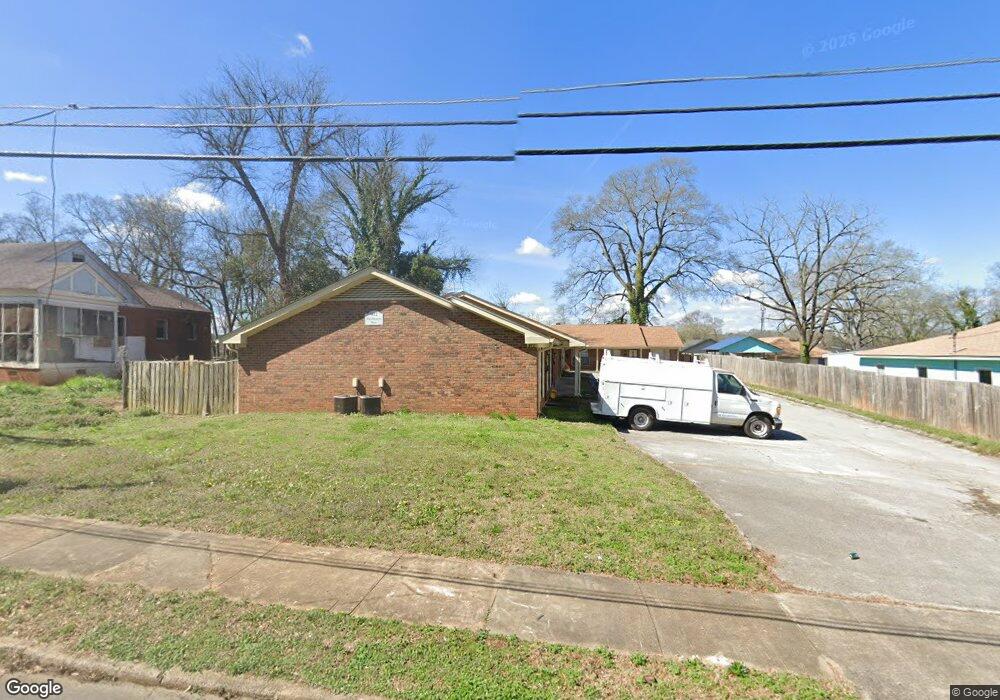
This home is located at 912 Darlington Way SW, Rome, GA 30161 and is currently estimated at $297,585, approximately $181 per square foot. 912 Darlington Way SW is a home located in Floyd County with nearby schools including Dan McCarty Middle School, Rome High School, and St. Mary School.
Ownership History
Date
Name
Owned For
Owner Type
Purchase Details
Closed on
Oct 1, 2018
Sold by
Toussaint Jean Luckner
Bought by
Jlt Construction Llc
Current Estimated Value
Purchase Details
Closed on
Apr 23, 2018
Sold by
Bailey Charles N
Bought by
Toussaint Jean Luckner
Home Financials for this Owner
Home Financials are based on the most recent Mortgage that was taken out on this home.
Original Mortgage
$140,000
Interest Rate
4.45%
Mortgage Type
New Conventional
Purchase Details
Closed on
Mar 4, 2014
Sold by
Smith Kenyon T
Bought by
Bailey Charles N
Purchase Details
Closed on
Jan 9, 2006
Sold by
Not Provided
Bought by
Smith Kenyon T
Purchase Details
Closed on
Jan 2, 1979
Sold by
Howell Adrian
Bought by
Bailey Charles N
Purchase Details
Closed on
Sep 29, 1970
Bought by
P and R
Purchase Details
Closed on
Sep 28, 1970
Bought by
Howell Adrian
Create a Home Valuation Report for This Property
The Home Valuation Report is an in-depth analysis detailing your home's value as well as a comparison with similar homes in the area
Home Values in the Area
Average Home Value in this Area
Purchase History
| Date | Buyer | Sale Price | Title Company |
|---|---|---|---|
| Jlt Construction Llc | -- | -- | |
| Toussaint Jean Luckner | $235,000 | -- | |
| Bailey Charles N | $209,100 | -- | |
| Smith Kenyon T | $220,000 | -- | |
| Bailey Charles N | $84,200 | -- | |
| P | -- | -- | |
| Howell Adrian | -- | -- |
Source: Public Records
Mortgage History
| Date | Status | Borrower | Loan Amount |
|---|---|---|---|
| Previous Owner | Toussaint Jean Luckner | $140,000 |
Source: Public Records
Tax History Compared to Growth
Tax History
| Year | Tax Paid | Tax Assessment Tax Assessment Total Assessment is a certain percentage of the fair market value that is determined by local assessors to be the total taxable value of land and additions on the property. | Land | Improvement |
|---|---|---|---|---|
| 2024 | $7,825 | $214,977 | $7,040 | $207,937 |
| 2023 | $7,613 | $173,990 | $7,040 | $166,950 |
| 2022 | $3,103 | $85,042 | $6,400 | $78,642 |
| 2021 | $3,155 | $85,042 | $6,400 | $78,642 |
| 2020 | $2,705 | $85,042 | $6,400 | $78,642 |
| 2019 | $3,089 | $83,440 | $6,400 | $77,040 |
| 2018 | $2,467 | $66,644 | $6,400 | $60,244 |
| 2017 | $2,461 | $66,466 | $6,400 | $60,066 |
| 2016 | $2,470 | $66,520 | $6,400 | $60,120 |
| 2015 | -- | $67,280 | $6,400 | $60,880 |
| 2014 | -- | $67,280 | $6,400 | $60,880 |
Source: Public Records
Map
Nearby Homes
- 162 E 11th St SE
- 170 E 11th St SW
- 9 Eastridge Ct SW
- 168 E 11th St SE
- 164 E 11th St SE
- 166 E 11th St SW
- 31 Notasulga Dr SW
- 2 E 10th St SW
- 801 Maple Ave SW
- 2 Fair St SW
- 2 Coral Ave SW
- 211 E 11th St SE
- 702 River Ave SW
- 4 E 15th St SW
- 1502 Spring Creek St SW
- 106 E 14th St SW
- 39 E 16th St SW
- 1314 E 2nd Ave SE
- 916 Darlington Way SW
- 908 Darlington Way SW
- 918 Darlington Way SW
- 917 Maple Ave SW
- 906 Darlington Way SW
- 909 Maple Ave SW
- 920 Darlington Way SW
- 919 Maple Ave SW
- 919 Maple Ave SW
- 915 Darlington Way SW
- 904 Darlington Way SW
- 907 Maple Ave SW Unit 2
- 907 Maple Ave SW Unit 5
- 907 Maple Ave SW Unit 4
- 907 Maple Ave SW Unit 3
- 907 Maple Ave SW Unit 1
- 907 Maple Ave SW
- 1 Eastridge Ct SW
- 921 Maple Ave SW
- 913 Maple Ave SW Unit A & B