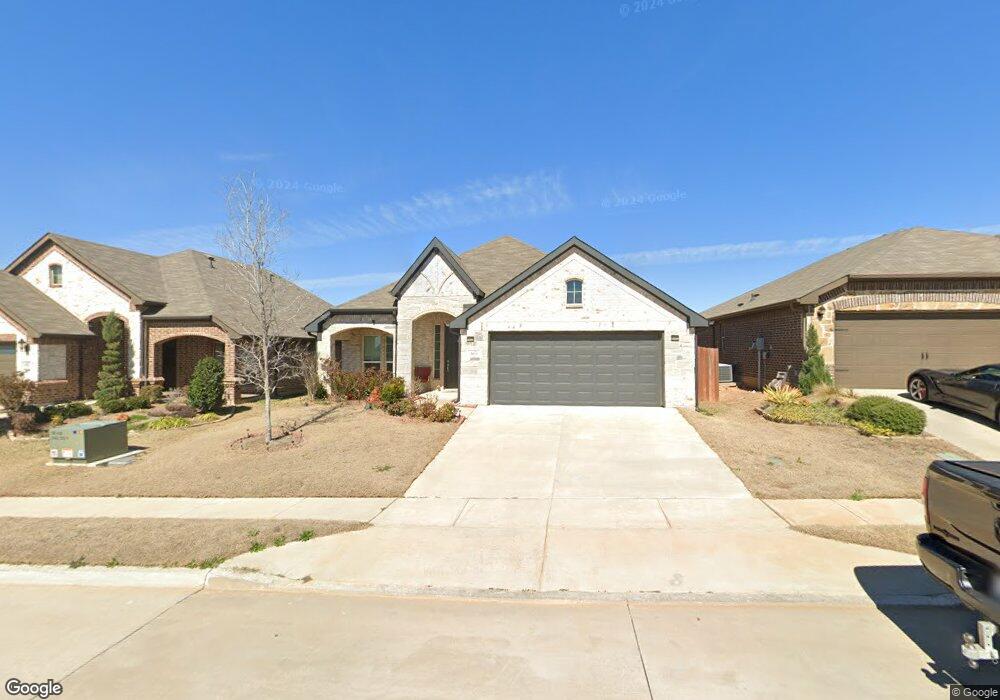
912 Deer Valley Dr Weatherford, TX 76087
Estimated Value: $344,021 - $395,000
3
Beds
2
Baths
1,991
Sq Ft
$182/Sq Ft
Est. Value
About This Home
This home is located at 912 Deer Valley Dr, Weatherford, TX 76087 and is currently estimated at $362,755, approximately $182 per square foot. 912 Deer Valley Dr is a home located in Parker County with nearby schools including Curtis Elementary School, Hall Middle School, and Weatherford High School.
Ownership History
Date
Name
Owned For
Owner Type
Purchase Details
Closed on
Dec 11, 2020
Sold by
Antares Acquisition Llc
Bought by
Subedi Bishnu Prasad and Subedi Renuka Chulagain
Current Estimated Value
Home Financials for this Owner
Home Financials are based on the most recent Mortgage that was taken out on this home.
Original Mortgage
$237,836
Outstanding Balance
$212,123
Interest Rate
2.8%
Mortgage Type
Credit Line Revolving
Estimated Equity
$150,632
Purchase Details
Closed on
Nov 18, 2019
Sold by
Weatherford 55 Ltd
Bought by
Antares Acquisition Llc
Home Financials for this Owner
Home Financials are based on the most recent Mortgage that was taken out on this home.
Original Mortgage
$4,000,000
Interest Rate
3.5%
Mortgage Type
Purchase Money Mortgage
Purchase Details
Closed on
Jan 6, 2017
Sold by
55 Ltd
Bought by
Impression Homes Llc
Create a Home Valuation Report for This Property
The Home Valuation Report is an in-depth analysis detailing your home's value as well as a comparison with similar homes in the area
Home Values in the Area
Average Home Value in this Area
Purchase History
| Date | Buyer | Sale Price | Title Company |
|---|---|---|---|
| Subedi Bishnu Prasad | -- | None Listed On Document | |
| Antares Acquisition Llc | -- | None Available | |
| Impression Homes Llc | -- | Fidelity National Title |
Source: Public Records
Mortgage History
| Date | Status | Borrower | Loan Amount |
|---|---|---|---|
| Open | Subedi Bishnu Prasad | $237,836 | |
| Previous Owner | Antares Acquisition Llc | $4,000,000 | |
| Closed | Impression Homes Llc | $0 |
Source: Public Records
Tax History Compared to Growth
Tax History
| Year | Tax Paid | Tax Assessment Tax Assessment Total Assessment is a certain percentage of the fair market value that is determined by local assessors to be the total taxable value of land and additions on the property. | Land | Improvement |
|---|---|---|---|---|
| 2025 | $7,291 | $360,740 | $50,000 | $310,740 |
| 2024 | $7,291 | $378,280 | $40,000 | $338,280 |
| 2023 | $7,291 | $378,280 | $40,000 | $338,280 |
| 2022 | $6,081 | $274,150 | $30,000 | $244,150 |
| 2021 | $6,584 | $274,150 | $30,000 | $244,150 |
| 2020 | $536 | $22,200 | $22,200 | $0 |
| 2019 | $567 | $22,200 | $22,200 | $0 |
| 2018 | $569 | $22,200 | $22,200 | $0 |
| 2017 | $789 | $30,000 | $30,000 | $0 |
Source: Public Records
Map
Nearby Homes
- 909 Jodie Dr
- 2533 Hadley St
- 825 Jodie Dr
- 2532 Hadley St
- 2209 Caroline Dr
- 914 Randall Rd
- 842 Randall Rd
- 1036 Deer Valley Dr
- 1220 Scott Dr
- 2381 Waggoner Ranch Dr
- 2361 Waggoner Ranch Dr
- 2416 Waggoner Ranch Dr
- 2344 Briscoe Ranch Dr
- 1015 W Park Ave Unit D
- 1015 W Park Ave Unit LOT A
- 1015 W Park Ave Unit LOT B
- 3770 Bethel Rd
- 1252 Kerrville Ln
- 1921 Bay Laurel Dr
- 124 Candleridge Ct
- 908 Deer Valley Dr
- 916 Deer Valley Dr
- 904 Deer Valley Dr
- 900 Deer Valley Dr
- 924 Deer Valley Dr
- 2501 Hadley St
- 928 Deer Valley Dr
- 913 Jodie Dr
- 917 Jodie Dr
- 917 Jodie Dr
- 905 Jodie Dr
- 2509 Hadley St
- 921 Jodie Dr
- 901 Jodie Dr
- 925 Jodie Dr
- 936 Deer Valley Dr
- 2513 Hadley St
- 929 Jodie Dr
- 2500 Hadley St
- 940 Deer Valley Dr