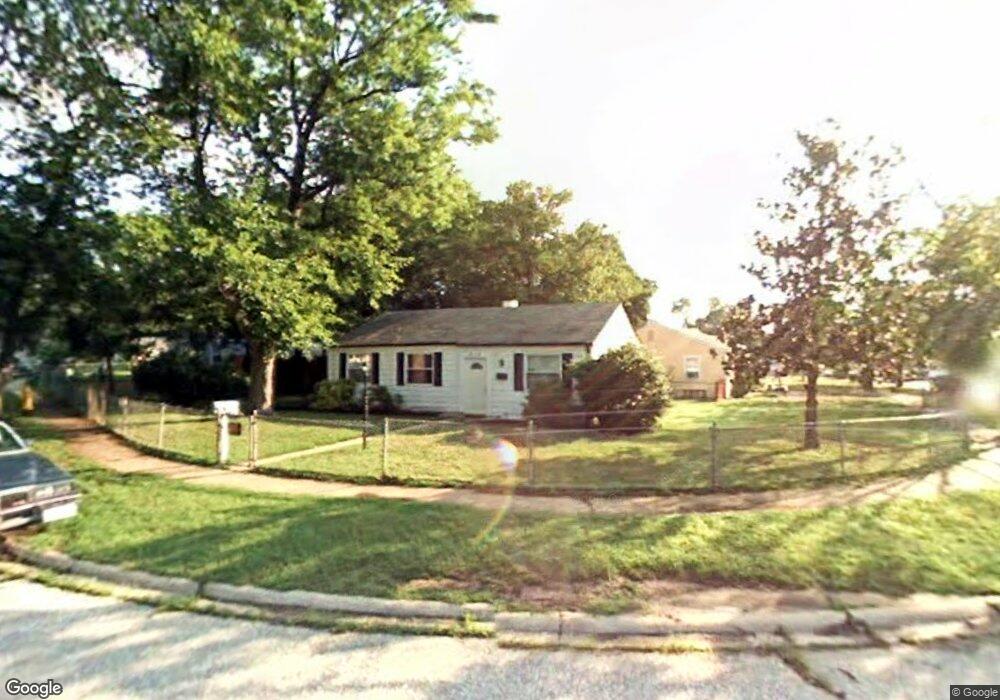
912 Dorking Rd Glen Burnie, MD 21061
Estimated Value: $251,000 - $334,000
--
Bed
1
Bath
988
Sq Ft
$313/Sq Ft
Est. Value
About This Home
This home is located at 912 Dorking Rd, Glen Burnie, MD 21061 and is currently estimated at $308,883, approximately $312 per square foot. 912 Dorking Rd is a home located in Anne Arundel County with nearby schools including Woodside Elementary School, Corkran Middle School, and Glen Burnie High School.
Ownership History
Date
Name
Owned For
Owner Type
Purchase Details
Closed on
Aug 22, 2019
Sold by
Second Reversionary Partnership
Bought by
A & L Llc
Current Estimated Value
Purchase Details
Closed on
Jul 23, 2001
Sold by
Secretary Of Housing & Urban Dev
Bought by
Lloyd David W
Purchase Details
Closed on
May 7, 2001
Sold by
Radovich Frances
Bought by
Secretary Of Housing & Urban Dev
Purchase Details
Closed on
Oct 6, 1999
Sold by
Radovich Frances
Bought by
Radovich Frances and Reilly Keith C
Purchase Details
Closed on
Dec 31, 1998
Sold by
Bangert Richard J
Bought by
Radovich Frances
Create a Home Valuation Report for This Property
The Home Valuation Report is an in-depth analysis detailing your home's value as well as a comparison with similar homes in the area
Home Values in the Area
Average Home Value in this Area
Purchase History
| Date | Buyer | Sale Price | Title Company |
|---|---|---|---|
| A & L Llc | $65,596 | None Available | |
| Lloyd David W | $83,651 | -- | |
| Secretary Of Housing & Urban Dev | $114,250 | -- | |
| Radovich Frances | -- | -- | |
| Radovich Frances | $106,000 | -- |
Source: Public Records
Mortgage History
| Date | Status | Borrower | Loan Amount |
|---|---|---|---|
| Closed | Radovich Frances | -- |
Source: Public Records
Tax History Compared to Growth
Tax History
| Year | Tax Paid | Tax Assessment Tax Assessment Total Assessment is a certain percentage of the fair market value that is determined by local assessors to be the total taxable value of land and additions on the property. | Land | Improvement |
|---|---|---|---|---|
| 2025 | $2,737 | $216,900 | $144,000 | $72,900 |
| 2024 | $2,737 | $204,067 | $0 | $0 |
| 2023 | $2,562 | $191,233 | $0 | $0 |
| 2022 | $2,295 | $178,400 | $114,000 | $64,400 |
| 2021 | $4,507 | $174,467 | $0 | $0 |
| 2020 | $2,171 | $170,533 | $0 | $0 |
| 2019 | $4,179 | $166,600 | $104,000 | $62,600 |
| 2018 | $1,657 | $163,400 | $0 | $0 |
| 2017 | $2,015 | $160,200 | $0 | $0 |
| 2016 | -- | $157,000 | $0 | $0 |
| 2015 | -- | $148,467 | $0 | $0 |
| 2014 | -- | $139,933 | $0 | $0 |
Source: Public Records
Map
Nearby Homes