Estimated Value: $89,000 - $199,000
3
Beds
2
Baths
640
Sq Ft
$212/Sq Ft
Est. Value
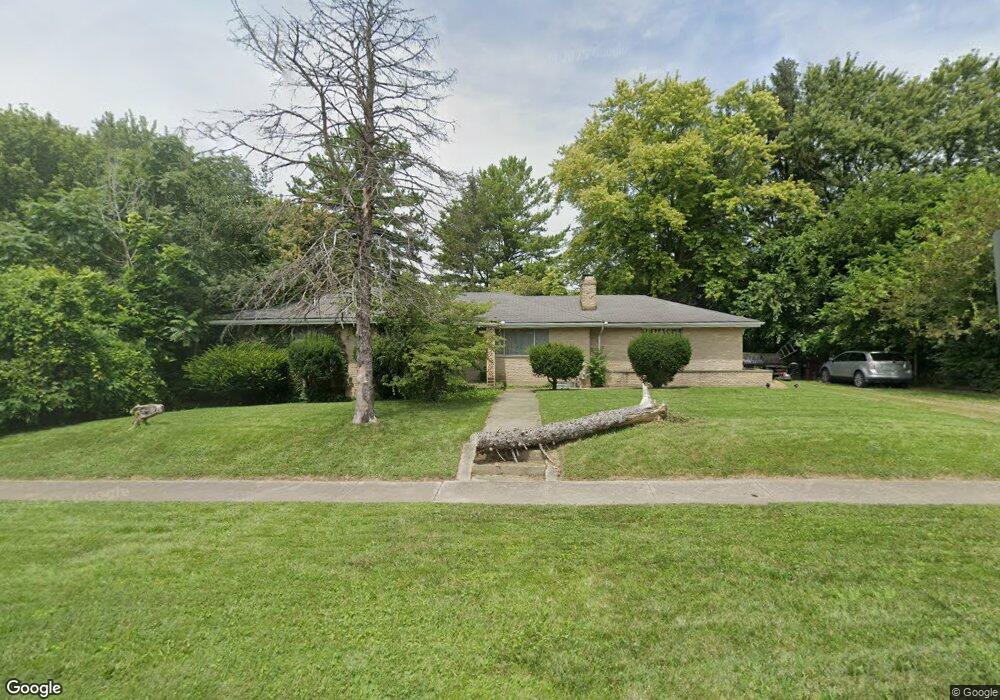
About This Home
This home is located at 912 E Main St, Xenia, OH 45385 and is currently estimated at $135,817, approximately $212 per square foot. 912 E Main St is a home located in Greene County with nearby schools including Xenia High School, Summit Academy Community School for Alternative Learners - Xenia, and Legacy Christian Academy.
Ownership History
Date
Name
Owned For
Owner Type
Purchase Details
Closed on
Nov 9, 2018
Sold by
Ames Fay L
Bought by
Halferty Donald
Current Estimated Value
Home Financials for this Owner
Home Financials are based on the most recent Mortgage that was taken out on this home.
Original Mortgage
$48,500
Outstanding Balance
$42,559
Interest Rate
4.7%
Mortgage Type
New Conventional
Estimated Equity
$93,258
Create a Home Valuation Report for This Property
The Home Valuation Report is an in-depth analysis detailing your home's value as well as a comparison with similar homes in the area
Home Values in the Area
Average Home Value in this Area
Purchase History
| Date | Buyer | Sale Price | Title Company |
|---|---|---|---|
| Halferty Donald | $50,000 | None Available |
Source: Public Records
Mortgage History
| Date | Status | Borrower | Loan Amount |
|---|---|---|---|
| Open | Halferty Donald | $48,500 |
Source: Public Records
Tax History
| Year | Tax Paid | Tax Assessment Tax Assessment Total Assessment is a certain percentage of the fair market value that is determined by local assessors to be the total taxable value of land and additions on the property. | Land | Improvement |
|---|---|---|---|---|
| 2024 | $1,192 | $27,370 | $3,740 | $23,630 |
| 2023 | $1,171 | $27,370 | $3,740 | $23,630 |
| 2022 | $991 | $19,760 | $3,400 | $16,360 |
| 2021 | $1,005 | $19,760 | $3,400 | $16,360 |
| 2020 | $963 | $19,760 | $3,400 | $16,360 |
| 2019 | $1,609 | $31,090 | $3,380 | $27,710 |
| 2018 | $1,615 | $31,090 | $3,380 | $27,710 |
| 2017 | $1,568 | $31,090 | $3,380 | $27,710 |
| 2016 | $1,575 | $29,750 | $3,380 | $26,370 |
| 2015 | $4,194 | $29,750 | $3,380 | $26,370 |
| 2014 | $1,233 | $29,750 | $3,380 | $26,370 |
Source: Public Records
Map
Nearby Homes
Your Personal Tour Guide
Ask me questions while you tour the home.