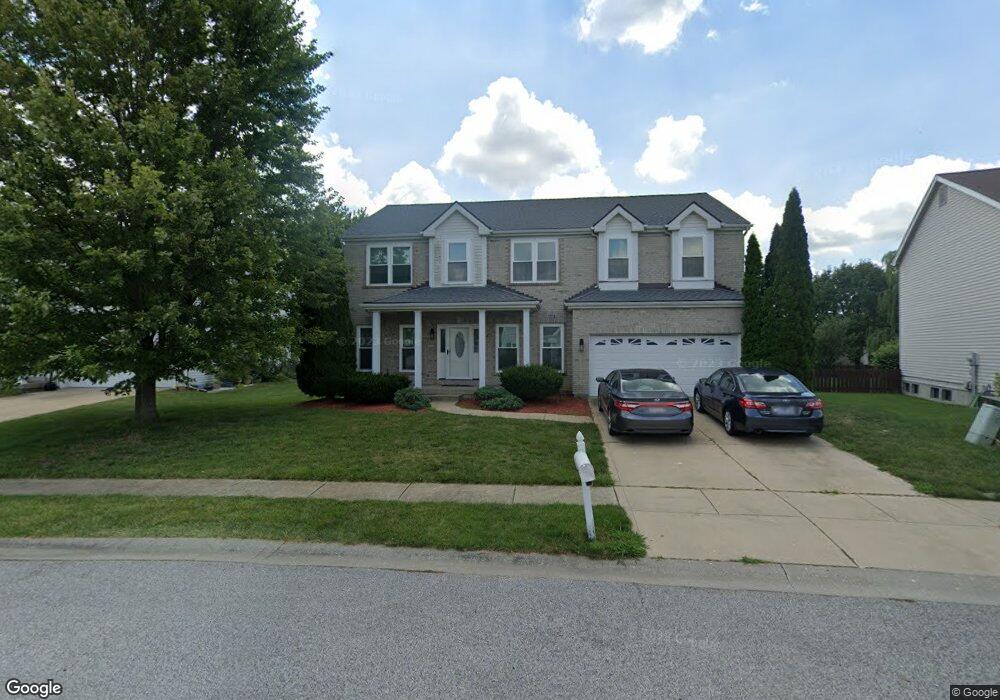
912 Fields End Ct Fairview Heights, IL 62208
Estimated Value: $345,000 - $367,000
Studio
--
Bath
1,640
Sq Ft
$217/Sq Ft
Est. Value
About This Home
This home is located at 912 Fields End Ct, Fairview Heights, IL 62208 and is currently estimated at $355,735, approximately $216 per square foot. 912 Fields End Ct is a home located in St. Clair County with nearby schools including William Holliday Elementary School, Pontiac William Holliday Jr High School, and O'Fallon Township High School.
Ownership History
Date
Name
Owned For
Owner Type
Purchase Details
Closed on
Oct 15, 2004
Sold by
Jackson Gaylord James and Daugherty Jackson Phyllis
Bought by
Jackson Ryan C L and Jackson Melanie A
Current Estimated Value
Home Financials for this Owner
Home Financials are based on the most recent Mortgage that was taken out on this home.
Original Mortgage
$227,900
Outstanding Balance
$119,238
Interest Rate
6.62%
Mortgage Type
New Conventional
Estimated Equity
$236,497
Purchase Details
Closed on
May 29, 2003
Sold by
The Jones Co Homes Llc
Bought by
Jackson Gaylord James and Daugherty Jackson Phyllis
Home Financials for this Owner
Home Financials are based on the most recent Mortgage that was taken out on this home.
Original Mortgage
$172,498
Interest Rate
5.9%
Mortgage Type
Balloon
Create a Home Valuation Report for This Property
The Home Valuation Report is an in-depth analysis detailing your home's value as well as a comparison with similar homes in the area
Home Values in the Area
Average Home Value in this Area
Purchase History
| Date | Buyer | Sale Price | Title Company |
|---|---|---|---|
| Jackson Ryan C L | $240,000 | Pti | |
| Jackson Gaylord James | $216,000 | Benchmark Title Company |
Source: Public Records
Mortgage History
| Date | Status | Borrower | Loan Amount |
|---|---|---|---|
| Open | Jackson Ryan C L | $227,900 | |
| Closed | Jackson Gaylord James | $172,498 |
Source: Public Records
Tax History
| Year | Tax Paid | Tax Assessment Tax Assessment Total Assessment is a certain percentage of the fair market value that is determined by local assessors to be the total taxable value of land and additions on the property. | Land | Improvement |
|---|---|---|---|---|
| 2024 | -- | $100,314 | $13,890 | $86,424 |
| 2023 | -- | $88,758 | $12,290 | $76,468 |
| 2022 | $0 | $81,292 | $12,045 | $69,247 |
| 2021 | $0 | $77,156 | $11,432 | $65,724 |
| 2020 | $5,008 | $73,087 | $10,829 | $62,258 |
| 2019 | $4,825 | $73,087 | $10,829 | $62,258 |
| 2018 | $4,534 | $67,313 | $11,579 | $55,734 |
| 2017 | $4,399 | $64,581 | $11,109 | $53,472 |
| 2016 | $4,372 | $63,123 | $10,858 | $52,265 |
| 2014 | $3,856 | $62,892 | $11,054 | $51,838 |
| 2013 | $3,909 | $64,052 | $11,258 | $52,794 |
Source: Public Records
Map
Nearby Homes
- 903 Coral Dr
- 104 Debra Dr
- 204 Pamona Dr
- 9 Hyde Park Rd
- 13 Joseph Dr
- 22 Lexington Dr
- 114 Ashland Ave
- 319 David Dr
- 918 Columbia Ave
- 919 Auburn Ct
- 517 Anita Dr
- 921 Chesapeake Junction Ln
- 821 Chesapeake Junction Ln
- 129 Toulon Ct
- 901 Silverlink Dr
- 5352 Tulane Ct
- 205 Belt Ave
- 709 Wild Horse Creek Dr
- 101 Toulon Ct
- 6817 Pelham Manor Dr
- 916 Fields End Ct
- 908 Fields End Ct
- 923 Holliday Dr
- 927 Holliday Dr
- 904 Fields End Ct
- 920 Fields End Ct
- 915 Holliday Dr
- 909 Fields End Ct
- 931 Holliday Dr
- 905 Fields End Ct
- 911 Holliday Dr
- 913 Fields End Ct
- 900 Fields End Ct
- 921 Fields End Ct
- 901 Fields End Ct
- 130 Bayberry Dr
- 917 Fields End Ct
- 114 Bayberry Dr
- 919 Fields End Ct
- 930 Holliday Dr
Your Personal Tour Guide
Ask me questions while you tour the home.