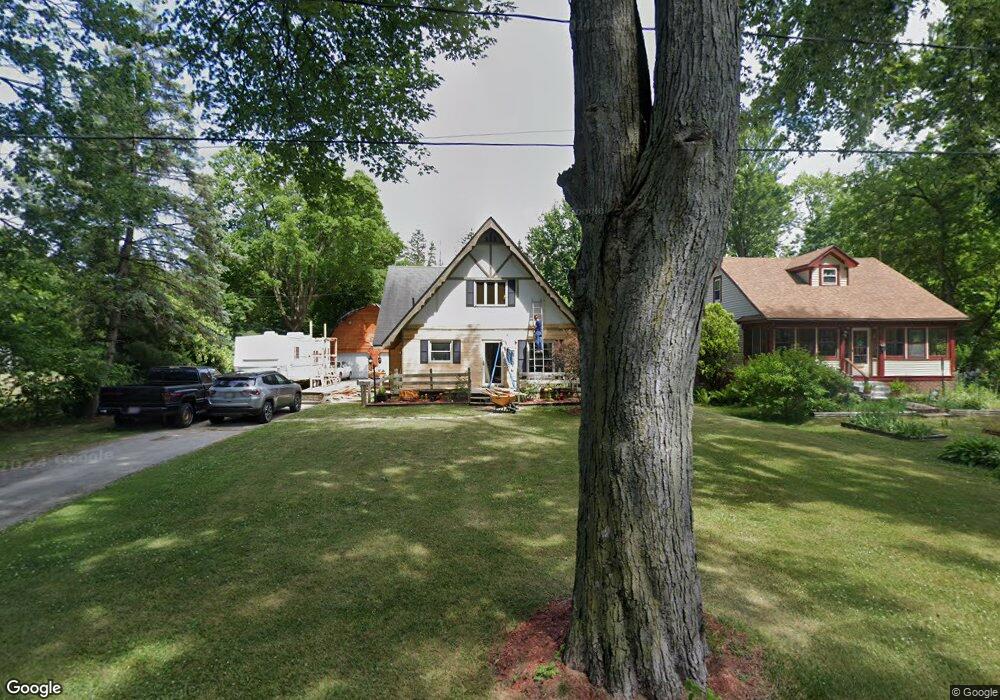
912 Harrow Rd Toledo, OH 43615
Reynolds Corners NeighborhoodEstimated Value: $171,000 - $193,000
3
Beds
2
Baths
1,922
Sq Ft
$96/Sq Ft
Est. Value
About This Home
This home is located at 912 Harrow Rd, Toledo, OH 43615 and is currently estimated at $183,579, approximately $95 per square foot. 912 Harrow Rd is a home located in Lucas County with nearby schools including McTigue Elementary School, Rogers High School, and Horizon Science Academy-Springfield.
Ownership History
Date
Name
Owned For
Owner Type
Purchase Details
Closed on
Jul 14, 2014
Sold by
Crye Jon M and Gibson Lisa M
Bought by
Wilson Amanda and Youngblood Austin
Current Estimated Value
Purchase Details
Closed on
Aug 2, 2004
Sold by
Freeman Sandra L and Lee Sandra L
Bought by
Crye Jon M and Gibson Lisa M
Home Financials for this Owner
Home Financials are based on the most recent Mortgage that was taken out on this home.
Original Mortgage
$117,500
Interest Rate
8.49%
Mortgage Type
Purchase Money Mortgage
Purchase Details
Closed on
Jun 12, 1990
Sold by
Goetz Ronald H
Create a Home Valuation Report for This Property
The Home Valuation Report is an in-depth analysis detailing your home's value as well as a comparison with similar homes in the area
Home Values in the Area
Average Home Value in this Area
Purchase History
| Date | Buyer | Sale Price | Title Company |
|---|---|---|---|
| Wilson Amanda | $113,000 | None Available | |
| Crye Jon M | $117,000 | -- | |
| -- | $77,000 | -- |
Source: Public Records
Mortgage History
| Date | Status | Borrower | Loan Amount |
|---|---|---|---|
| Previous Owner | Crye Jon M | $117,500 |
Source: Public Records
Tax History Compared to Growth
Tax History
| Year | Tax Paid | Tax Assessment Tax Assessment Total Assessment is a certain percentage of the fair market value that is determined by local assessors to be the total taxable value of land and additions on the property. | Land | Improvement |
|---|---|---|---|---|
| 2024 | $2,944 | $45,955 | $7,140 | $38,815 |
| 2023 | $2,448 | $36,715 | $6,160 | $30,555 |
| 2022 | $2,429 | $36,715 | $6,160 | $30,555 |
| 2021 | $2,512 | $36,715 | $6,160 | $30,555 |
| 2020 | $2,372 | $30,135 | $5,075 | $25,060 |
| 2019 | $2,292 | $30,135 | $5,075 | $25,060 |
| 2018 | $2,349 | $30,135 | $5,075 | $25,060 |
| 2017 | $6,926 | $30,100 | $8,225 | $21,875 |
| 2016 | $3,890 | $86,000 | $23,500 | $62,500 |
| 2015 | $2,397 | $86,000 | $23,500 | $62,500 |
| 2014 | $2,840 | $30,110 | $8,230 | $21,880 |
| 2013 | $1,894 | $30,110 | $8,230 | $21,880 |
Source: Public Records
Map
Nearby Homes
- 4860 Airport Hwy
- 1101 Sawyer Rd
- 5805 Fryer Ave
- 428 Deline Dr
- 5873 Nebraska Ave
- 5665 Camberley Dr
- 1925 Olimphia Rd
- 1916 Birkdale Rd
- 5057 Brandon Rd
- 419 N Holland Sylvania Rd
- 1930 Birkdale Rd
- 5051 Wissman Rd
- 5331 Fleet Rd
- 5041 Ancil Rd
- 5845 Cook Dr
- 1709 Acorn Dr
- 5029 Kellogg Rd
- 1911 N Holland Sylvania Rd
- 1966 Devinci Dr
- 312 Hayes Rd