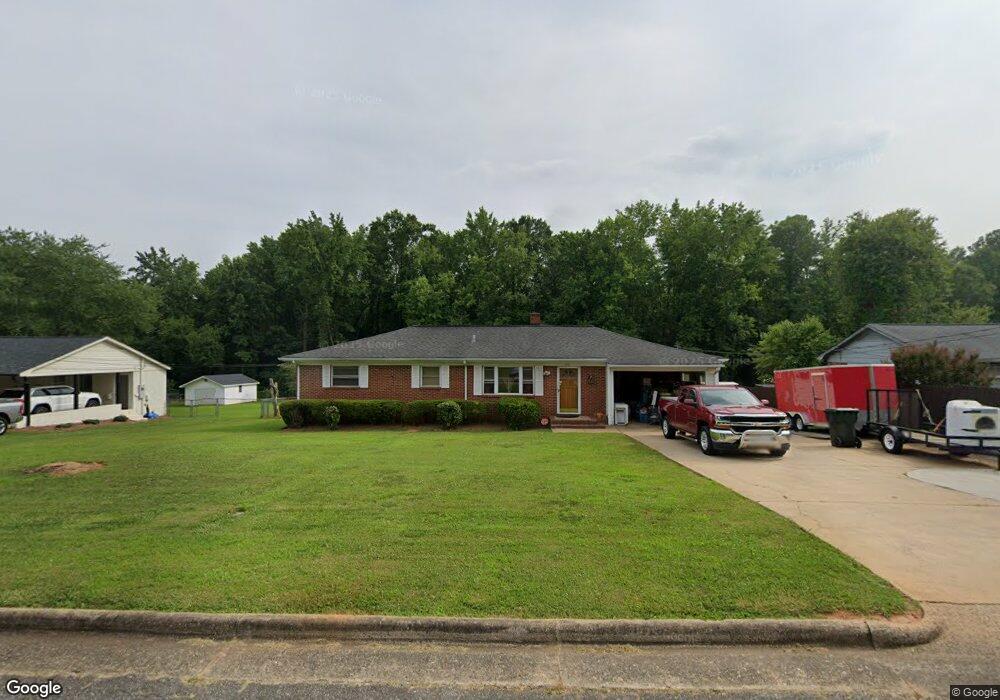
912 Henry St Kings Mountain, NC 28086
Estimated Value: $237,285 - $281,000
3
Beds
2
Baths
1,573
Sq Ft
$164/Sq Ft
Est. Value
About This Home
This home is located at 912 Henry St, Kings Mountain, NC 28086 and is currently estimated at $257,571, approximately $163 per square foot. 912 Henry St is a home located in Gaston County with nearby schools including Chapel Grove Elementary School, Bessemer City Middle School, and Bessemer City High School.
Ownership History
Date
Name
Owned For
Owner Type
Purchase Details
Closed on
May 21, 2010
Sold by
Beard Barbara L and Beard John E
Bought by
Black Deborah B
Current Estimated Value
Home Financials for this Owner
Home Financials are based on the most recent Mortgage that was taken out on this home.
Original Mortgage
$119,897
Outstanding Balance
$80,283
Interest Rate
5.03%
Mortgage Type
New Conventional
Estimated Equity
$177,288
Purchase Details
Closed on
Aug 23, 2005
Sold by
Lewis James H
Bought by
Beard Barbara L
Create a Home Valuation Report for This Property
The Home Valuation Report is an in-depth analysis detailing your home's value as well as a comparison with similar homes in the area
Home Values in the Area
Average Home Value in this Area
Purchase History
| Date | Buyer | Sale Price | Title Company |
|---|---|---|---|
| Black Deborah B | $117,500 | None Available | |
| Beard Barbara L | -- | None Available | |
| Beard Barbara L | -- | None Available |
Source: Public Records
Mortgage History
| Date | Status | Borrower | Loan Amount |
|---|---|---|---|
| Open | Black Deborah B | $119,897 |
Source: Public Records
Tax History Compared to Growth
Tax History
| Year | Tax Paid | Tax Assessment Tax Assessment Total Assessment is a certain percentage of the fair market value that is determined by local assessors to be the total taxable value of land and additions on the property. | Land | Improvement |
|---|---|---|---|---|
| 2025 | $2,076 | $202,516 | $24,975 | $177,541 |
| 2024 | $1,433 | $120,597 | $23,310 | $97,287 |
| 2023 | $1,426 | $120,597 | $23,310 | $97,287 |
| 2022 | $1,366 | $120,597 | $23,310 | $97,287 |
| 2021 | $1,373 | $120,597 | $23,310 | $97,287 |
| 2020 | $1,101 | $93,798 | $23,310 | $70,488 |
| 2019 | $1,101 | $93,798 | $23,310 | $70,488 |
| 2018 | $1,100 | $93,798 | $23,310 | $70,488 |
| 2017 | $1,094 | $93,798 | $23,310 | $70,488 |
| 2016 | $1,097 | $93,798 | $23,310 | $70,488 |
| 2015 | $1,039 | $91,102 | $19,425 | $71,677 |
| 2014 | $1,039 | $91,102 | $19,425 | $71,677 |
Source: Public Records
Map
Nearby Homes