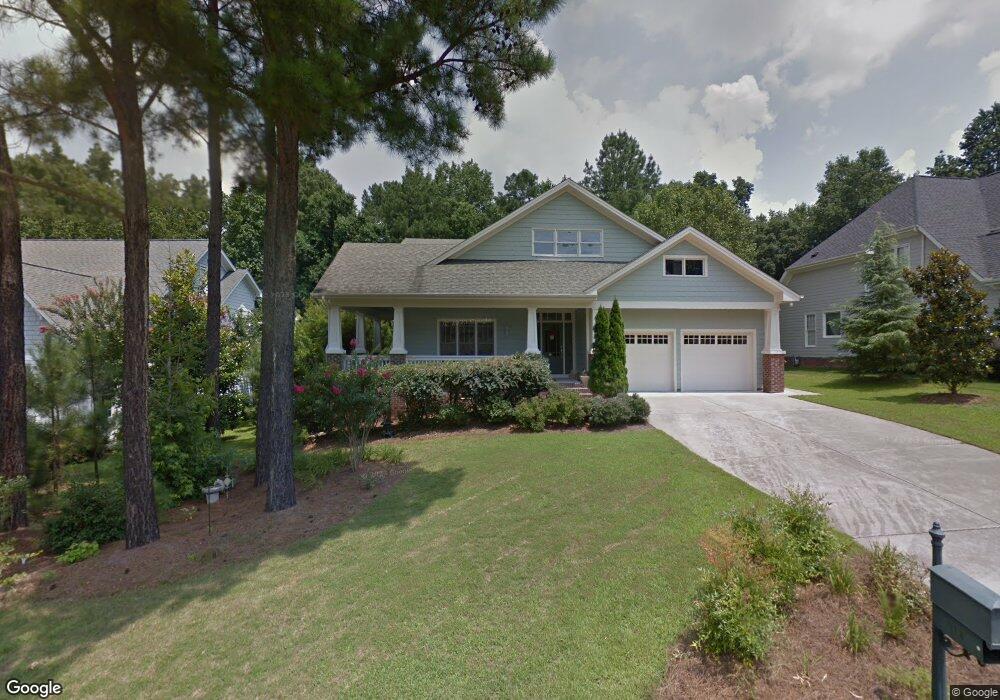
912 Hidden Jewel Ln Wake Forest, NC 27587
Estimated Value: $670,177 - $769,000
4
Beds
3
Baths
2,946
Sq Ft
$250/Sq Ft
Est. Value
About This Home
This home is located at 912 Hidden Jewel Ln, Wake Forest, NC 27587 and is currently estimated at $736,044, approximately $249 per square foot. 912 Hidden Jewel Ln is a home located in Wake County with nearby schools including Heritage Elementary School, Heritage Middle School, and Heritage High School.
Ownership History
Date
Name
Owned For
Owner Type
Purchase Details
Closed on
Jul 24, 2002
Sold by
Tingen Construction Company Inc
Bought by
Holtman Derek R and Holtman Mandy W
Current Estimated Value
Home Financials for this Owner
Home Financials are based on the most recent Mortgage that was taken out on this home.
Original Mortgage
$271,750
Outstanding Balance
$114,465
Interest Rate
6.62%
Estimated Equity
$621,579
Purchase Details
Closed on
Apr 23, 2002
Sold by
Homes By Dickerson Inc
Bought by
Tingen Construction Company Inc
Home Financials for this Owner
Home Financials are based on the most recent Mortgage that was taken out on this home.
Original Mortgage
$262,000
Interest Rate
7.07%
Mortgage Type
Construction
Create a Home Valuation Report for This Property
The Home Valuation Report is an in-depth analysis detailing your home's value as well as a comparison with similar homes in the area
Home Values in the Area
Average Home Value in this Area
Purchase History
| Date | Buyer | Sale Price | Title Company |
|---|---|---|---|
| Holtman Derek R | $340,000 | -- | |
| Tingen Construction Company Inc | $62,500 | -- |
Source: Public Records
Mortgage History
| Date | Status | Borrower | Loan Amount |
|---|---|---|---|
| Open | Holtman Derek R | $271,750 | |
| Previous Owner | Tingen Construction Company Inc | $262,000 | |
| Closed | Tingen Construction Company Inc | $10,000 |
Source: Public Records
Tax History Compared to Growth
Tax History
| Year | Tax Paid | Tax Assessment Tax Assessment Total Assessment is a certain percentage of the fair market value that is determined by local assessors to be the total taxable value of land and additions on the property. | Land | Improvement |
|---|---|---|---|---|
| 2025 | $5,873 | $611,687 | $115,000 | $496,687 |
| 2024 | $5,851 | $611,687 | $115,000 | $496,687 |
| 2023 | $4,933 | $422,774 | $80,000 | $342,774 |
| 2022 | $4,732 | $422,774 | $80,000 | $342,774 |
| 2021 | $4,649 | $422,774 | $80,000 | $342,774 |
| 2020 | $4,649 | $422,774 | $80,000 | $342,774 |
| 2019 | $5,042 | $404,761 | $62,000 | $342,761 |
| 2018 | $4,774 | $404,761 | $62,000 | $342,761 |
| 2017 | $4,614 | $404,761 | $62,000 | $342,761 |
| 2016 | $4,555 | $404,761 | $62,000 | $342,761 |
| 2015 | $5,391 | $473,393 | $84,000 | $389,393 |
| 2014 | $5,218 | $473,393 | $84,000 | $389,393 |
Source: Public Records
Map
Nearby Homes
- 904 Hidden Jewel Ln
- 925 Hidden Jewel Ln
- 1009 Hidden Jewel Ln
- 1203 Fairview Club Dr
- 1205 Fairview Club Dr
- 1225 Fairview Club Dr
- 1213 Crozier Ct
- 1224 Legacy Greene Ave
- 1300 Brewer Jackson Ct
- 413 Dimock Way
- 404 Vodin St
- 1304 Heritage Heights Ln
- 404 Dimock Way
- 1344 Heritage Hills Way
- 1308 Groves Field Ln
- 329 Dimock Way
- 517 Hammond Oak Ln
- 305 Heflin Ct
- 1300 Heritage Club Ave
- 520 Hallburg Ct
- 908 Hidden Jewel Ln
- 916 Hidden Jewel Ln
- 920 Hidden Jewel Ln
- 913 Hidden Jewel Ln
- 909 Hidden Jewel Ln
- 900 Hidden Jewel Ln
- 917 Hidden Jewel Ln
- 924 Hidden Jewel Ln
- 905 Hidden Jewel Ln
- 921 Hidden Jewel Ln
- 901 Hidden Jewel Ln
- 828 Hidden Jewel Ln
- 928 Hidden Jewel Ln
- 829 Hidden Jewel Ln
- 824 Hidden Jewel Ln
- 1541 Gracie Girl Way
- 1541 Gracie Girl Way Unit 14
- 1537 Gracie Girl Way
- 1000 Hidden Jewel Ln
- 1001 Hidden Jewel Ln