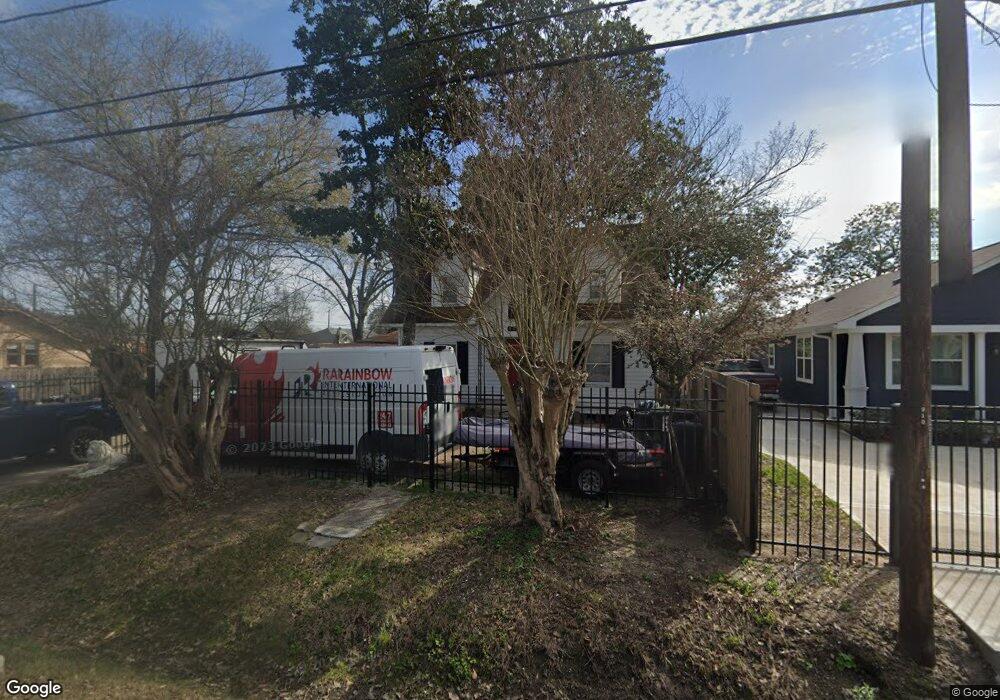
912 King St Houston, TX 77022
Northside-Northline NeighborhoodEstimated Value: $219,446 - $336,000
3
Beds
1
Bath
1,039
Sq Ft
$277/Sq Ft
Est. Value
About This Home
This home is located at 912 King St, Houston, TX 77022 and is currently estimated at $287,362, approximately $276 per square foot. 912 King St is a home located in Harris County with nearby schools including Roosevelt Elementary School, Burbank Middle School, and Northside High School.
Ownership History
Date
Name
Owned For
Owner Type
Purchase Details
Closed on
Feb 22, 2012
Sold by
Nirode Vanessa
Bought by
Lestig Lance Christian
Current Estimated Value
Purchase Details
Closed on
Mar 29, 2002
Sold by
Mahon Durward
Bought by
Nirode Vanessa
Home Financials for this Owner
Home Financials are based on the most recent Mortgage that was taken out on this home.
Original Mortgage
$74,650
Interest Rate
6.83%
Purchase Details
Closed on
Nov 13, 1997
Sold by
Swinney Willie Fay
Bought by
Felter Capital Ltd
Create a Home Valuation Report for This Property
The Home Valuation Report is an in-depth analysis detailing your home's value as well as a comparison with similar homes in the area
Home Values in the Area
Average Home Value in this Area
Purchase History
| Date | Buyer | Sale Price | Title Company |
|---|---|---|---|
| Lestig Lance Christian | -- | None Available | |
| Nirode Vanessa | -- | North American Title Co | |
| Felter Capital Ltd | -- | -- |
Source: Public Records
Mortgage History
| Date | Status | Borrower | Loan Amount |
|---|---|---|---|
| Previous Owner | Nirode Vanessa | $74,650 |
Source: Public Records
Tax History Compared to Growth
Tax History
| Year | Tax Paid | Tax Assessment Tax Assessment Total Assessment is a certain percentage of the fair market value that is determined by local assessors to be the total taxable value of land and additions on the property. | Land | Improvement |
|---|---|---|---|---|
| 2025 | $4,007 | $202,488 | $105,600 | $96,888 |
| 2024 | $4,007 | $191,526 | $52,800 | $138,726 |
| 2023 | $4,007 | $191,526 | $52,800 | $138,726 |
| 2022 | $3,426 | $155,609 | $52,800 | $102,809 |
| 2021 | $2,992 | $128,387 | $52,800 | $75,587 |
| 2020 | $3,109 | $128,387 | $52,800 | $75,587 |
| 2019 | $3,249 | $128,387 | $52,800 | $75,587 |
| 2018 | $2,702 | $106,792 | $52,800 | $53,992 |
| 2017 | $2,700 | $106,792 | $52,800 | $53,992 |
| 2016 | $2,700 | $106,792 | $52,800 | $53,992 |
| 2015 | $1,840 | $83,617 | $27,720 | $55,897 |
| 2014 | $1,840 | $71,562 | $27,720 | $43,842 |
Source: Public Records
Map
Nearby Homes