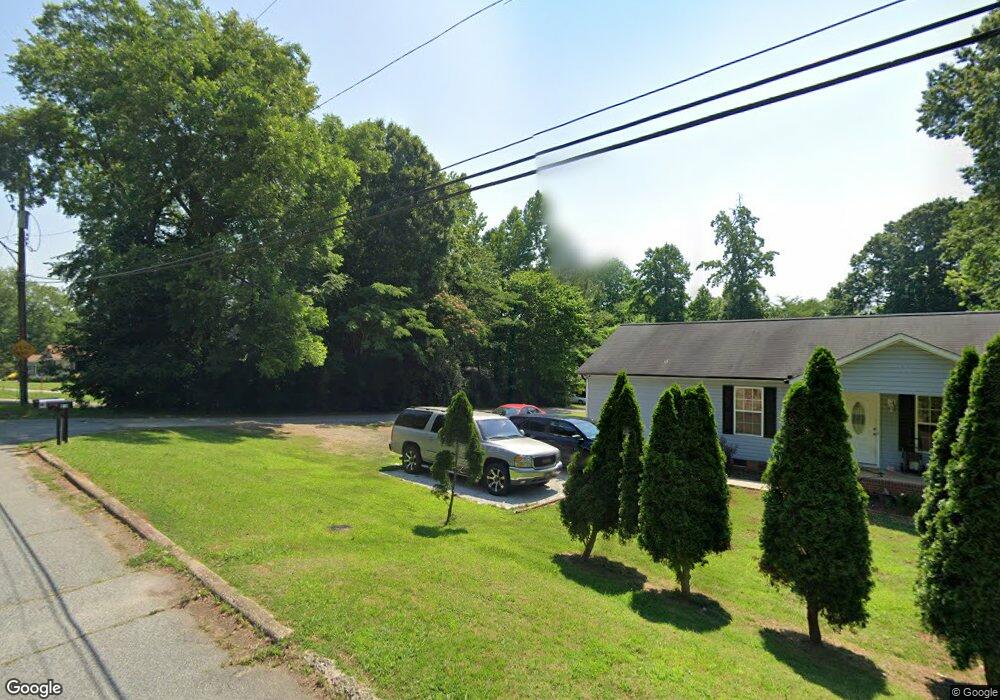
912 Lisk St Salisbury, NC 28144
Estimated Value: $144,000 - $181,096
3
Beds
2
Baths
1,120
Sq Ft
$148/Sq Ft
Est. Value
About This Home
This home is located at 912 Lisk St, Salisbury, NC 28144 and is currently estimated at $165,274, approximately $147 per square foot. 912 Lisk St is a home located in Rowan County with nearby schools including Elizabeth Duncan Koontz Elementary School, Knox Middle School, and North Rowan Middle School.
Ownership History
Date
Name
Owned For
Owner Type
Purchase Details
Closed on
Apr 8, 2021
Sold by
Deer Properties Llc
Bought by
Stone Properties & Development Llc
Current Estimated Value
Home Financials for this Owner
Home Financials are based on the most recent Mortgage that was taken out on this home.
Original Mortgage
$80,000
Outstanding Balance
$72,288
Interest Rate
3.05%
Mortgage Type
Purchase Money Mortgage
Estimated Equity
$92,986
Purchase Details
Closed on
Jan 31, 2020
Sold by
L D Propertis Llc
Bought by
Deer Creek Properties Llc
Home Financials for this Owner
Home Financials are based on the most recent Mortgage that was taken out on this home.
Original Mortgage
$212,100
Interest Rate
3.7%
Mortgage Type
Unknown
Purchase Details
Closed on
Jan 9, 2003
Bought by
Ld Properties Llc
Create a Home Valuation Report for This Property
The Home Valuation Report is an in-depth analysis detailing your home's value as well as a comparison with similar homes in the area
Home Values in the Area
Average Home Value in this Area
Purchase History
| Date | Buyer | Sale Price | Title Company |
|---|---|---|---|
| Stone Properties & Development Llc | $100,000 | None Available | |
| Deer Creek Properties Llc | $210,000 | None Available | |
| Ld Properties Llc | -- | -- |
Source: Public Records
Mortgage History
| Date | Status | Borrower | Loan Amount |
|---|---|---|---|
| Open | Stone Properties & Development Llc | $80,000 | |
| Previous Owner | Deer Creek Properties Llc | $212,100 |
Source: Public Records
Tax History Compared to Growth
Tax History
| Year | Tax Paid | Tax Assessment Tax Assessment Total Assessment is a certain percentage of the fair market value that is determined by local assessors to be the total taxable value of land and additions on the property. | Land | Improvement |
|---|---|---|---|---|
| 2025 | $1,345 | $112,495 | $9,660 | $102,835 |
| 2024 | $1,345 | $112,495 | $9,660 | $102,835 |
| 2023 | $1,345 | $112,495 | $9,660 | $102,835 |
| 2022 | $1,054 | $76,539 | $8,114 | $68,425 |
| 2021 | $1,054 | $76,539 | $8,114 | $68,425 |
| 2020 | $1,054 | $76,539 | $8,114 | $68,425 |
| 2019 | $1,054 | $76,539 | $8,114 | $68,425 |
| 2018 | $868 | $63,852 | $8,114 | $55,738 |
| 2017 | $863 | $63,852 | $8,114 | $55,738 |
| 2016 | $839 | $63,852 | $8,114 | $55,738 |
| 2015 | $844 | $63,852 | $8,114 | $55,738 |
| 2014 | $853 | $65,280 | $7,341 | $57,939 |
Source: Public Records
Map
Nearby Homes
- 829 Green St
- 1120 Crestview Ave
- 628 E Lafayette St
- 000 Bringle Ferry Rd
- 1713 N Clay St
- 1116 Bryce Ave
- 1102 Grady St
- 1138 Laurel St
- 1104 Grady St
- 0 E Bringle Ferry Rd Unit CAR4281801
- 1214 Short St
- 1270 N Shaver St
- 1280 N Shaver St
- 501 E Lafayette St
- 1124 Butler St
- Lot 1 Grady St
- 610 Pinewood Ave
- TBD Miller Ave
- 805 Park Ave
- 505 E Cemetery St