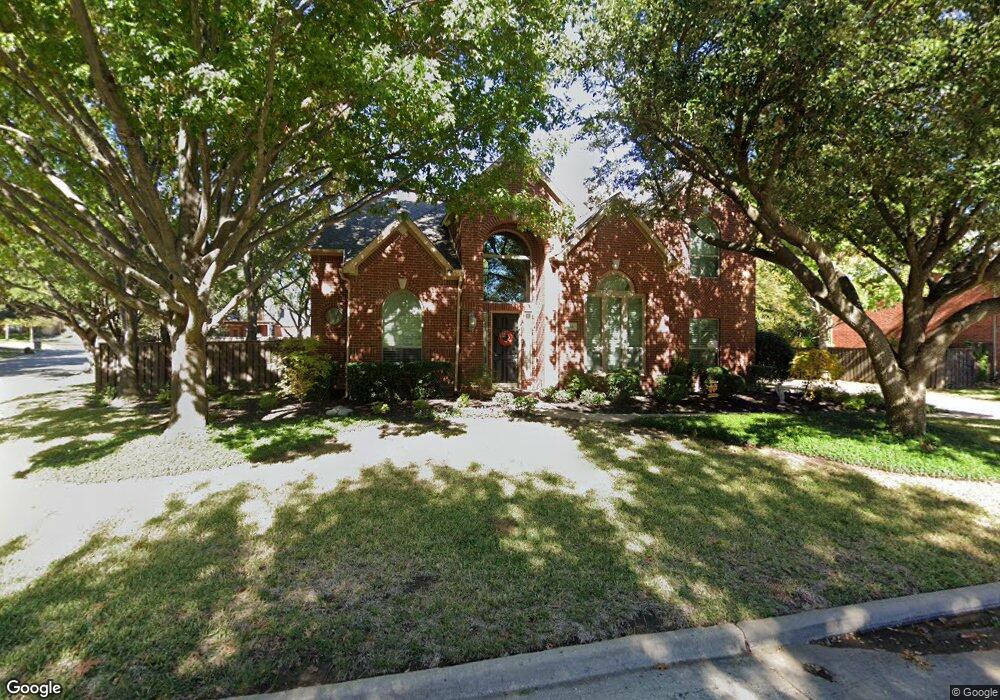
912 Midland Creek Dr Southlake, TX 76092
Estimated Value: $1,021,000 - $1,149,000
4
Beds
4
Baths
3,404
Sq Ft
$320/Sq Ft
Est. Value
About This Home
This home is located at 912 Midland Creek Dr, Southlake, TX 76092 and is currently estimated at $1,087,865, approximately $319 per square foot. 912 Midland Creek Dr is a home located in Tarrant County with nearby schools including Robert High Rockenbaugh Elementary School, Eubanks Intermediate School, and George Dawson Middle School.
Ownership History
Date
Name
Owned For
Owner Type
Purchase Details
Closed on
Aug 6, 2007
Sold by
Munden Raymond M and Munden Nancy J
Bought by
Iannelli Richard D and Iannelli Eileen M
Current Estimated Value
Home Financials for this Owner
Home Financials are based on the most recent Mortgage that was taken out on this home.
Original Mortgage
$367,400
Outstanding Balance
$232,381
Interest Rate
6.64%
Mortgage Type
Purchase Money Mortgage
Estimated Equity
$855,484
Purchase Details
Closed on
Aug 4, 1995
Sold by
The Drees Company
Bought by
Munden Raymond M and Munden Nancy J
Home Financials for this Owner
Home Financials are based on the most recent Mortgage that was taken out on this home.
Original Mortgage
$239,000
Interest Rate
7.54%
Create a Home Valuation Report for This Property
The Home Valuation Report is an in-depth analysis detailing your home's value as well as a comparison with similar homes in the area
Home Values in the Area
Average Home Value in this Area
Purchase History
| Date | Buyer | Sale Price | Title Company |
|---|---|---|---|
| Iannelli Richard D | -- | None Available | |
| Munden Raymond M | -- | Safeco Land Title |
Source: Public Records
Mortgage History
| Date | Status | Borrower | Loan Amount |
|---|---|---|---|
| Open | Iannelli Richard D | $367,400 | |
| Previous Owner | Munden Raymond M | $239,000 |
Source: Public Records
Tax History Compared to Growth
Tax History
| Year | Tax Paid | Tax Assessment Tax Assessment Total Assessment is a certain percentage of the fair market value that is determined by local assessors to be the total taxable value of land and additions on the property. | Land | Improvement |
|---|---|---|---|---|
| 2025 | $11,554 | $814,000 | $175,000 | $639,000 |
| 2024 | $11,554 | $875,000 | $175,000 | $700,000 |
| 2023 | $12,858 | $837,999 | $175,000 | $662,999 |
| 2022 | $13,835 | $700,000 | $150,000 | $550,000 |
| 2021 | $13,292 | $615,000 | $150,000 | $465,000 |
| 2020 | $12,183 | $530,000 | $150,000 | $380,000 |
| 2019 | $12,834 | $530,000 | $150,000 | $380,000 |
| 2018 | $11,083 | $490,000 | $105,000 | $385,000 |
| 2017 | $12,145 | $490,000 | $105,000 | $385,000 |
| 2016 | $12,261 | $494,671 | $105,000 | $389,671 |
| 2015 | $10,113 | $457,000 | $85,000 | $372,000 |
| 2014 | $10,113 | $420,100 | $55,000 | $365,100 |
Source: Public Records
Map
Nearby Homes
- 708 Nettleton Dr
- 710 Longford Dr
- 712 Ashleigh Ln
- 1100 La Paloma Ct
- 1012 Cool River Dr
- 1227 Strathmore Dr
- 221 Pine Dr
- 608 Regency Crossing
- 1420 Kensington Ct
- 1401 Chardonnay Ct
- 351 S White Chapel Blvd
- 521 Regency Crossing
- 1032 Rosavine Dr
- 1028 Rosavine Dr
- 1017 Rosavine Dr
- 1004 Rosavine Dr
- 1020 Rosavine Dr
- 1012 Rosavine Dr
- 1024 Rosavine Dr
- 1005 Rosavine Dr
- 914 Midland Creek Dr
- 709 Nettleton Dr
- 916 Midland Creek Dr
- 711 Nettleton Dr
- 907 Midland Creek Dr
- 905 Midland Creek Dr
- 913 Midland Creek Dr
- 911 Midland Creek Dr
- 909 Midland Creek Dr
- 713 Nettleton Dr
- 915 Midland Creek Dr
- 903 Midland Creek Dr
- 917 Midland Creek Dr
- 901 Midland Creek Dr
- 900 Nettleton Ct
- 919 Midland Creek Dr
- 902 Nettleton Ct
- 706 Nettleton Dr
- 710 Nettleton Dr
- 704 Nettleton Dr