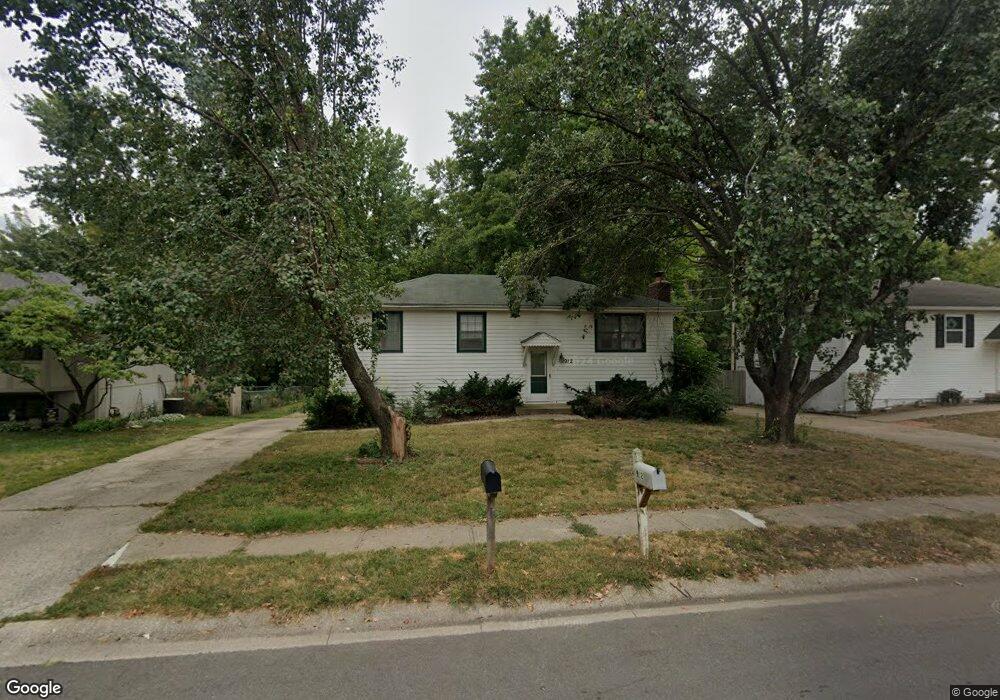
912 NE Locust Dr Blue Springs, MO 64014
Estimated Value: $231,000 - $260,000
3
Beds
1
Bath
1,008
Sq Ft
$242/Sq Ft
Est. Value
About This Home
This home is located at 912 NE Locust Dr, Blue Springs, MO 64014 and is currently estimated at $243,787, approximately $241 per square foot. 912 NE Locust Dr is a home located in Jackson County with nearby schools including James Walker Elementary School, Brittany Hill Middle School, and Blue Springs High School.
Ownership History
Date
Name
Owned For
Owner Type
Purchase Details
Closed on
Oct 10, 2001
Sold by
Willett Myles
Bought by
Butcher Jesse E
Current Estimated Value
Home Financials for this Owner
Home Financials are based on the most recent Mortgage that was taken out on this home.
Original Mortgage
$90,452
Outstanding Balance
$35,277
Interest Rate
6.84%
Mortgage Type
Purchase Money Mortgage
Estimated Equity
$208,510
Purchase Details
Closed on
Sep 8, 2001
Sold by
Willett Myles W
Bought by
Willett Matthew Wade
Home Financials for this Owner
Home Financials are based on the most recent Mortgage that was taken out on this home.
Original Mortgage
$90,452
Outstanding Balance
$35,277
Interest Rate
6.84%
Mortgage Type
Purchase Money Mortgage
Estimated Equity
$208,510
Purchase Details
Closed on
Oct 25, 1996
Sold by
Broadus Carolyn J
Bought by
Willett Myles
Home Financials for this Owner
Home Financials are based on the most recent Mortgage that was taken out on this home.
Original Mortgage
$70,800
Interest Rate
8.15%
Mortgage Type
Purchase Money Mortgage
Create a Home Valuation Report for This Property
The Home Valuation Report is an in-depth analysis detailing your home's value as well as a comparison with similar homes in the area
Home Values in the Area
Average Home Value in this Area
Purchase History
| Date | Buyer | Sale Price | Title Company |
|---|---|---|---|
| Butcher Jesse E | -- | Ati Title Company | |
| Willett Matthew Wade | -- | -- | |
| Willett Myles | -- | -- |
Source: Public Records
Mortgage History
| Date | Status | Borrower | Loan Amount |
|---|---|---|---|
| Open | Butcher Jesse E | $90,452 | |
| Previous Owner | Willett Myles | $70,800 |
Source: Public Records
Tax History Compared to Growth
Tax History
| Year | Tax Paid | Tax Assessment Tax Assessment Total Assessment is a certain percentage of the fair market value that is determined by local assessors to be the total taxable value of land and additions on the property. | Land | Improvement |
|---|---|---|---|---|
| 2025 | $3,233 | $30,905 | $6,857 | $24,048 |
| 2024 | $3,171 | $39,632 | $5,476 | $34,156 |
| 2023 | $3,171 | $39,632 | $4,501 | $35,131 |
| 2022 | $2,116 | $23,370 | $6,099 | $17,271 |
| 2021 | $2,114 | $23,370 | $6,099 | $17,271 |
| 2020 | $2,163 | $22,185 | $6,099 | $16,086 |
| 2019 | $1,907 | $22,185 | $6,099 | $16,086 |
| 2018 | $1,963 | $21,982 | $4,286 | $17,696 |
| 2017 | $2,519 | $21,982 | $4,286 | $17,696 |
| 2016 | $1,909 | $21,432 | $3,363 | $18,069 |
| 2014 | $1,790 | $20,030 | $3,143 | $16,887 |
Source: Public Records
Map
Nearby Homes
- 705 NE Locust Dr
- 1136 NE 10th St
- 1001 NE Wien Ave
- 2401 NE Coronado Dr
- 0 NE Jefferson St
- 458 NE Coronado Dr
- 2012 NE Adams Dairy Rd
- 420 NE Golfview Dr
- 1200 NE Crestview Dr
- 1800 NE Waterfield Village Ct
- 1200 NE Hilltop Dr
- 816 NE Mary Ct
- 517 NE Johnston Dr
- 1855 NE Duncan Rd
- 311 NE Bridge Place
- 408 NE 6th St Unit C
- 404 NE Lee Dr
- 204 NW Golfview Dr
- 0 NW Jefferson St
- 409 NW Locust Dr
- 908 NE Locust Dr
- 916 NE Locust Dr
- 904 NE Locust Dr
- 920 NE Locust Dr
- 905 NE Locust Dr
- 909 NE Locust Dr
- 1101 NE 9th Street Terrace
- 900 NE Locust Dr
- 924 NE Locust Dr
- 913 NE Locust Dr
- 1105 NE 9th Street Terrace
- 1108 NE 9th Street Terrace
- 917 NE Locust Dr
- 808 NE Locust Dr
- 928 NE Locust Dr
- 1108 NE 9th St
- 921 NE Locust Dr
- 1112 NE 9th Street Terrace
- 1109 NE 9th Street Terrace
- 804 NE Locust Dr