912 Pearce St Fall River, MA 02720
Highlands-Fall River NeighborhoodEstimated Value: $419,033 - $486,000
3
Beds
1
Bath
1,560
Sq Ft
$291/Sq Ft
Est. Value
About This Home
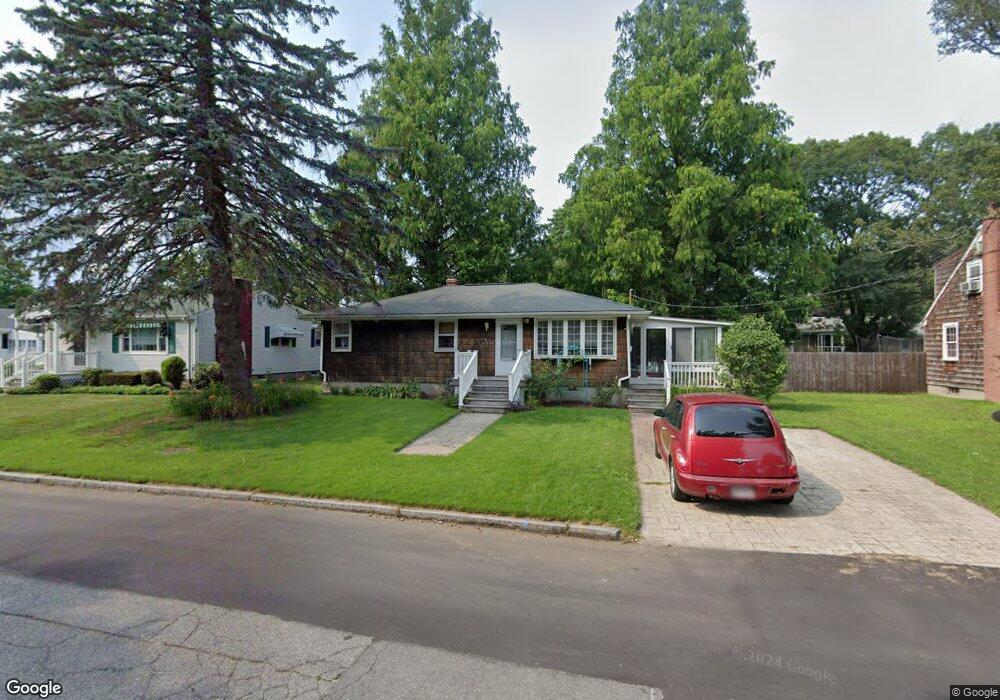
This home is located at 912 Pearce St, Fall River, MA 02720 and is currently estimated at $454,508, approximately $291 per square foot. 912 Pearce St is a home located in Bristol County with nearby schools including Spencer Borden Elementary School, Morton Middle School, and B M C Durfee High School.
Ownership History
Date
Name
Owned For
Owner Type
Purchase Details
Closed on
Aug 20, 1991
Sold by
Dean Edward Broughton and Dean Lillian
Bought by
Berube Michele L and Turner Veronica
Current Estimated Value
Home Financials for this Owner
Home Financials are based on the most recent Mortgage that was taken out on this home.
Original Mortgage
$100,000
Interest Rate
9.56%
Mortgage Type
Purchase Money Mortgage
Create a Home Valuation Report for This Property
The Home Valuation Report is an in-depth analysis detailing your home's value as well as a comparison with similar homes in the area
Home Values in the Area
Average Home Value in this Area
Purchase History
| Date | Buyer | Sale Price | Title Company |
|---|---|---|---|
| Berube Michele L | $118,000 | -- |
Source: Public Records
Mortgage History
| Date | Status | Borrower | Loan Amount |
|---|---|---|---|
| Open | Berube Michele L | $82,250 | |
| Closed | Berube Michele L | $93,500 | |
| Closed | Berube Michele L | $100,000 |
Source: Public Records
Tax History
| Year | Tax Paid | Tax Assessment Tax Assessment Total Assessment is a certain percentage of the fair market value that is determined by local assessors to be the total taxable value of land and additions on the property. | Land | Improvement |
|---|---|---|---|---|
| 2025 | $3,879 | $338,800 | $140,600 | $198,200 |
| 2024 | $3,635 | $316,400 | $135,100 | $181,300 |
| 2023 | $3,496 | $284,900 | $116,900 | $168,000 |
| 2022 | $3,054 | $244,500 | $109,300 | $135,200 |
| 2021 | $3,054 | $220,800 | $109,600 | $111,200 |
| 2020 | $3,020 | $209,000 | $109,800 | $99,200 |
| 2019 | $2,971 | $203,800 | $111,600 | $92,200 |
| 2018 | $3,025 | $206,900 | $117,800 | $89,100 |
| 2017 | $2,794 | $199,600 | $112,100 | $87,500 |
| 2016 | $2,688 | $197,200 | $114,400 | $82,800 |
| 2015 | $2,399 | $183,400 | $100,600 | $82,800 |
| 2014 | $2,307 | $183,400 | $100,600 | $82,800 |
Source: Public Records
Map
Nearby Homes
- 301 Madison St
- 108 Garden St
- 499 Hanover St
- 1231 Robeson St
- 65 Bigelow St
- 503 Highland Ave
- 742 New Boston Rd
- 25 O'Hearn St
- 545 Robeson St
- 45-47 Shawmut St
- 213 Weetamoe St
- 909 High St Unit 1
- 889 High St
- 267 Lincoln Ave
- 27 Kane St
- 677 Oak Grove Ave
- 295 Newbury St
- 208 Florence St
- 72 Belmont St
- 160 Stewart St
Your Personal Tour Guide
Ask me questions while you tour the home.