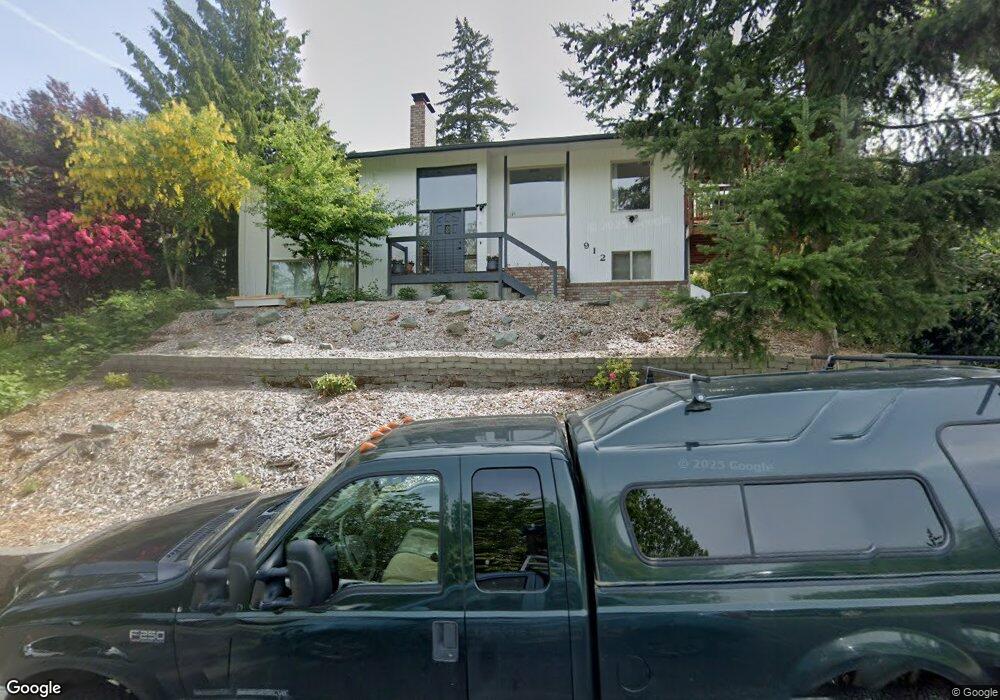
912 Puget St Bellingham, WA 98229
Puget NeighborhoodEstimated Value: $774,257 - $972,000
3
Beds
3
Baths
2,028
Sq Ft
$419/Sq Ft
Est. Value
About This Home
This home is located at 912 Puget St, Bellingham, WA 98229 and is currently estimated at $849,314, approximately $418 per square foot. 912 Puget St is a home located in Whatcom County with nearby schools including Carl Cozier Elementary School, Kulshan Middle School, and Sehome High School.
Ownership History
Date
Name
Owned For
Owner Type
Purchase Details
Closed on
May 13, 2008
Sold by
Altshuler Philip and Altshuler Patricia
Bought by
Bain Anne H
Current Estimated Value
Purchase Details
Closed on
Oct 23, 2001
Sold by
Lachmanec Gloria A and Ireland Perry R
Bought by
Altshuler Philip and Altshuler Patricia
Home Financials for this Owner
Home Financials are based on the most recent Mortgage that was taken out on this home.
Original Mortgage
$180,800
Interest Rate
6.87%
Purchase Details
Closed on
Jul 2, 1999
Sold by
Swanson Robert L and Swanson Audrey K
Bought by
Lachmanec Gloria A and Ireland Perry R
Home Financials for this Owner
Home Financials are based on the most recent Mortgage that was taken out on this home.
Original Mortgage
$176,000
Interest Rate
7.24%
Create a Home Valuation Report for This Property
The Home Valuation Report is an in-depth analysis detailing your home's value as well as a comparison with similar homes in the area
Home Values in the Area
Average Home Value in this Area
Purchase History
| Date | Buyer | Sale Price | Title Company |
|---|---|---|---|
| Bain Anne H | $369,280 | Chicago Title Insurance | |
| Altshuler Philip | $226,000 | Stewart Title | |
| Lachmanec Gloria A | $220,000 | Charter Title Corporation |
Source: Public Records
Mortgage History
| Date | Status | Borrower | Loan Amount |
|---|---|---|---|
| Previous Owner | Altshuler Philip | $180,800 | |
| Previous Owner | Lachmanec Gloria A | $176,000 |
Source: Public Records
Tax History Compared to Growth
Tax History
| Year | Tax Paid | Tax Assessment Tax Assessment Total Assessment is a certain percentage of the fair market value that is determined by local assessors to be the total taxable value of land and additions on the property. | Land | Improvement |
|---|---|---|---|---|
| 2024 | $5,525 | $685,457 | $288,887 | $396,570 |
| 2023 | $5,525 | $709,964 | $299,216 | $410,748 |
| 2022 | $4,526 | $604,228 | $254,653 | $349,575 |
| 2021 | $4,207 | $487,294 | $205,371 | $281,923 |
| 2020 | $4,131 | $427,448 | $180,149 | $247,299 |
| 2019 | $3,978 | $405,740 | $171,000 | $234,740 |
| 2018 | $4,130 | $391,667 | $155,155 | $236,512 |
| 2017 | $3,639 | $347,660 | $137,720 | $209,940 |
| 2016 | $3,315 | $320,155 | $126,720 | $193,435 |
| 2015 | $3,263 | $303,652 | $120,120 | $183,532 |
| 2014 | -- | $289,185 | $114,400 | $174,785 |
| 2013 | -- | $275,047 | $110,000 | $165,047 |
Source: Public Records
Map
Nearby Homes
- 905 Queen St
- 0 Lopez St
- 1401 Edwards St
- 805 Nevada St
- 115 43rd St
- 143 S 44th St
- 1200 Lincoln St Unit 196
- 1200 Lincoln St Unit 117
- 1200 Lincoln St Unit 154
- 1227 Puget St
- 1501 Lakeway Dr
- 842 Woodbine Way
- 4224 Dumas Ave
- 1356 Orleans St
- 1142 Whidbey St
- 1146 Whidbey St
- 1101 Whidbey St
- 0 Princeton Ct
- 1205 E Maple St
- 4007 Adams Ave