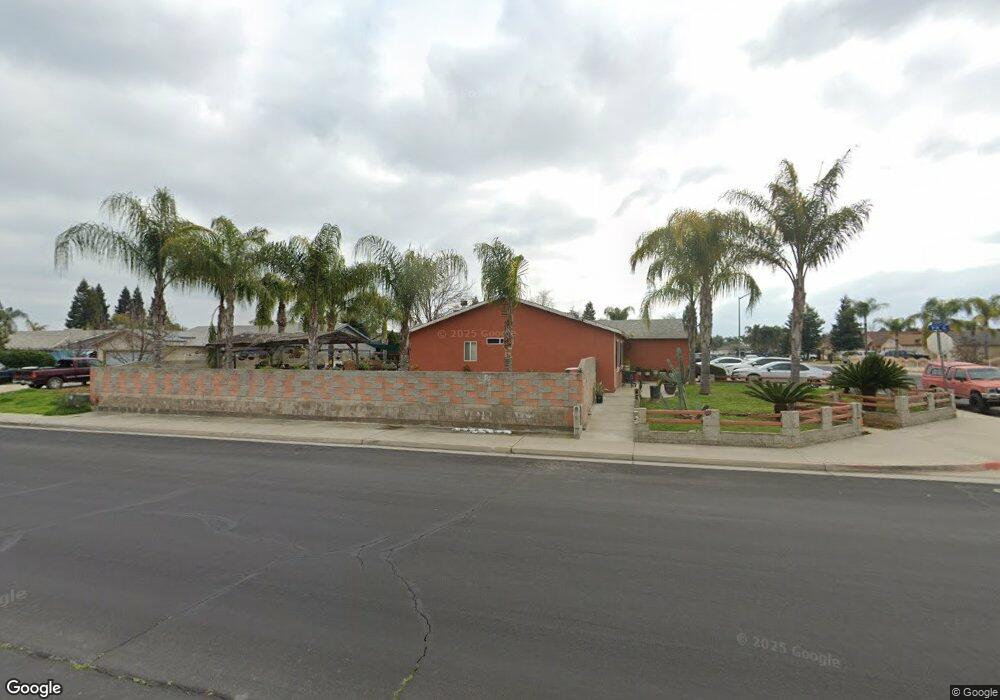
912 Recreation Ave Sanger, CA 93657
Estimated Value: $308,000 - $371,000
3
Beds
2
Baths
1,216
Sq Ft
$280/Sq Ft
Est. Value
About This Home
This home is located at 912 Recreation Ave, Sanger, CA 93657 and is currently estimated at $340,846, approximately $280 per square foot. 912 Recreation Ave is a home located in Fresno County with nearby schools including Wilson Elementary School, Washington Academic Middle School, and Sanger High School.
Ownership History
Date
Name
Owned For
Owner Type
Purchase Details
Closed on
Jun 2, 2004
Sold by
Tamez Rolando
Bought by
Rodriguez David and Rodriguez Rosa L
Current Estimated Value
Purchase Details
Closed on
Sep 15, 1998
Sold by
Deluca Rodney J and Deluca Marcella
Bought by
Tamez Rolando
Home Financials for this Owner
Home Financials are based on the most recent Mortgage that was taken out on this home.
Original Mortgage
$62,650
Interest Rate
6.76%
Create a Home Valuation Report for This Property
The Home Valuation Report is an in-depth analysis detailing your home's value as well as a comparison with similar homes in the area
Home Values in the Area
Average Home Value in this Area
Purchase History
We collect this data history from publicly available records. To have your information removed, we recommend requesting removal directly through your county’s website.
| Date | Buyer | Sale Price | Title Company |
|---|---|---|---|
| Rodriguez David | $138,500 | First American Title Ins Co | |
| Tamez Rolando | $89,500 | First American Title Co | |
| Deluca Rodney J | -- | First American Title Co |
Source: Public Records
Mortgage History
We collect this data history from publicly available records. To have your information removed, we recommend requesting removal directly through your county’s website.
| Date | Status | Borrower | Loan Amount |
|---|---|---|---|
| Previous Owner | Tamez Rolando | $62,650 | |
| Closed | Tamez Rolando | $25,360 |
Source: Public Records
Tax History
| Year | Tax Paid | Tax Assessment Tax Assessment Total Assessment is a certain percentage of the fair market value that is determined by local assessors to be the total taxable value of land and additions on the property. | Land | Improvement |
|---|---|---|---|---|
| 2025 | $2,506 | $196,901 | $52,596 | $144,305 |
| 2023 | $2,347 | $189,256 | $50,554 | $138,702 |
| 2022 | $2,311 | $185,546 | $49,563 | $135,983 |
| 2021 | $2,293 | $181,909 | $48,592 | $133,317 |
| 2020 | $2,226 | $180,044 | $48,094 | $131,950 |
| 2019 | $2,181 | $176,514 | $47,151 | $129,363 |
| 2018 | $2,091 | $173,054 | $46,227 | $126,827 |
| 2017 | $2,055 | $169,662 | $45,321 | $124,341 |
| 2016 | $1,688 | $145,000 | $30,000 | $115,000 |
| 2015 | $1,429 | $119,500 | $31,800 | $87,700 |
| 2014 | $1,349 | $112,000 | $29,800 | $82,200 |
Source: Public Records
Map
Nearby Homes
Your Personal Tour Guide
Ask me questions while you tour the home.