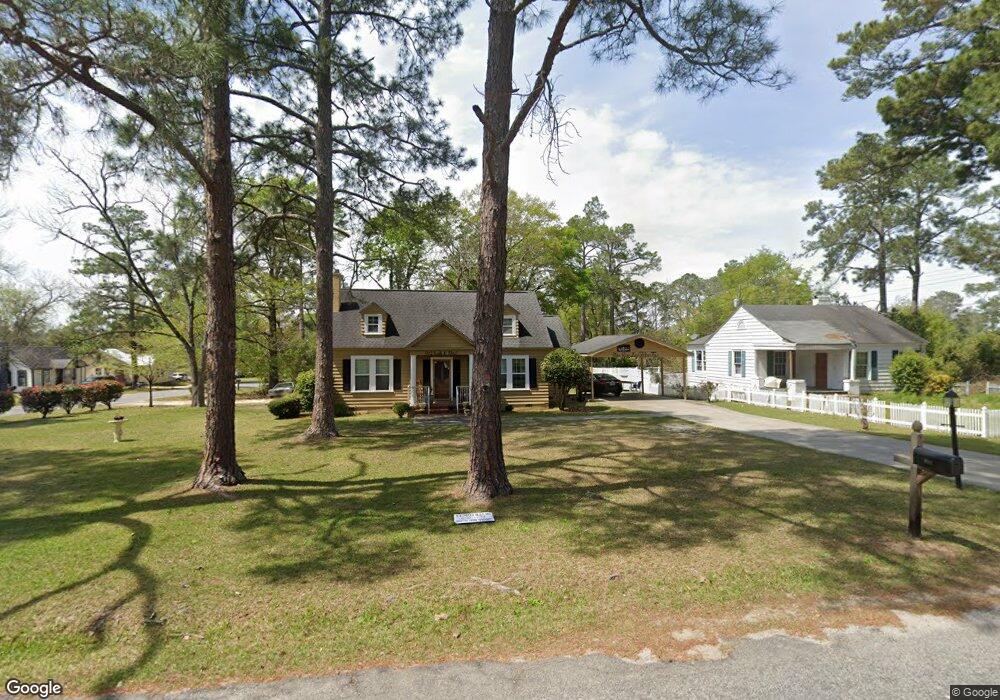
912 S 4th St Cordele, GA 31015
Estimated Value: $100,404 - $143,000
--
Bed
2
Baths
1,188
Sq Ft
$108/Sq Ft
Est. Value
About This Home
This home is located at 912 S 4th St, Cordele, GA 31015 and is currently estimated at $127,851, approximately $107 per square foot. 912 S 4th St is a home located in Crisp County with nearby schools including Crisp County Elementary School, Crisp County Primary School, and Crisp County Middle School.
Ownership History
Date
Name
Owned For
Owner Type
Purchase Details
Closed on
Jul 1, 2022
Sold by
Felton Shelton
Bought by
Lsk Felton Llc
Current Estimated Value
Purchase Details
Closed on
Jun 28, 2002
Sold by
Jones Rosa
Bought by
Felton Shelton
Purchase Details
Closed on
Feb 5, 2001
Sold by
Jones Terry
Bought by
Jones Rosa
Purchase Details
Closed on
May 12, 1993
Sold by
Felton Larry D
Bought by
Jones Terry
Purchase Details
Closed on
Aug 13, 1991
Bought by
Felton Larry D
Create a Home Valuation Report for This Property
The Home Valuation Report is an in-depth analysis detailing your home's value as well as a comparison with similar homes in the area
Home Values in the Area
Average Home Value in this Area
Purchase History
| Date | Buyer | Sale Price | Title Company |
|---|---|---|---|
| Lsk Felton Llc | -- | -- | |
| Felton Shelton | -- | -- | |
| Jones Rosa | -- | -- | |
| Jones Terry | $25,000 | -- | |
| Felton Larry D | $26,400 | -- |
Source: Public Records
Tax History Compared to Growth
Tax History
| Year | Tax Paid | Tax Assessment Tax Assessment Total Assessment is a certain percentage of the fair market value that is determined by local assessors to be the total taxable value of land and additions on the property. | Land | Improvement |
|---|---|---|---|---|
| 2024 | $1,434 | $40,005 | $2,067 | $37,938 |
| 2023 | $1,369 | $36,506 | $2,067 | $34,439 |
| 2022 | $911 | $34,448 | $2,067 | $32,381 |
| 2021 | $892 | $32,391 | $2,067 | $30,324 |
| 2020 | $912 | $32,391 | $2,067 | $30,324 |
| 2019 | $919 | $32,391 | $2,067 | $30,324 |
| 2018 | $816 | $27,691 | $3,307 | $24,384 |
| 2017 | $1,124 | $27,691 | $3,307 | $24,384 |
| 2016 | $819 | $27,691 | $3,307 | $24,384 |
| 2015 | -- | $27,691 | $3,307 | $24,384 |
| 2014 | -- | $27,691 | $3,307 | $24,384 |
| 2013 | -- | $27,690 | $3,306 | $24,384 |
Source: Public Records
Map
Nearby Homes