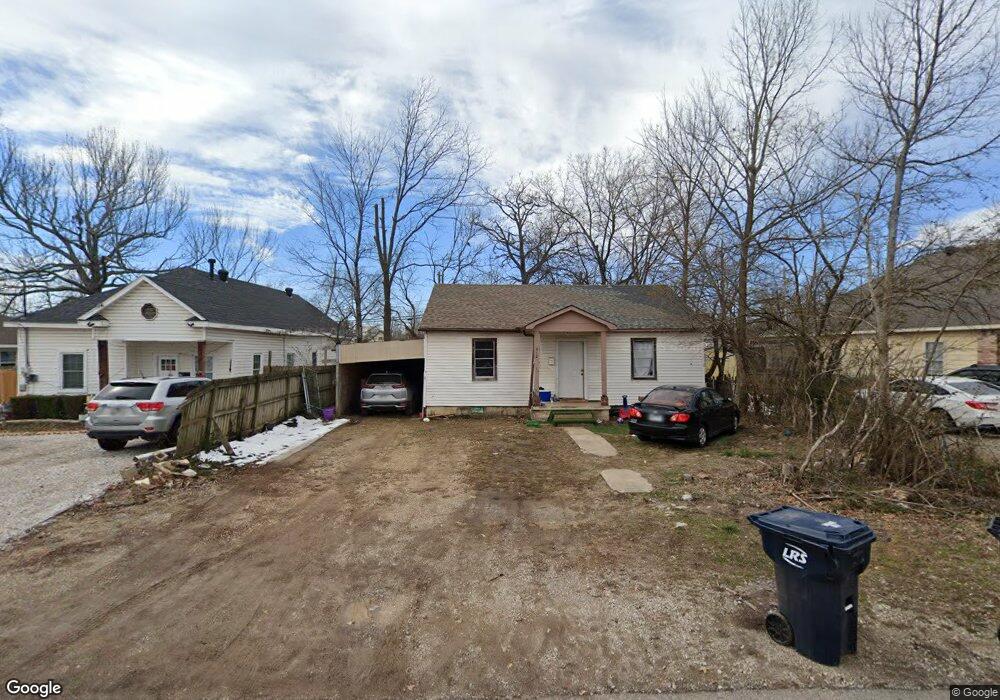
912 S B St Rogers, AR 72756
Estimated Value: $172,000 - $230,000
About This Home
This home is located at 912 S B St, Rogers, AR 72756 and is currently estimated at $196,078, approximately $211 per square foot. 912 S B St is a home located in Benton County with nearby schools including Frank Tillery Elementary School, Lingle Middle School, and Rogers Heritage High School.
Ownership History
We collect this data history from publicly available records. To have your information removed, we recommend requesting removal directly through your county’s website.
Purchase Details
Purchase Details
Purchase Details
Purchase Details
Purchase Details
Purchase Details
Purchase Details
Home Values in the Area
Average Home Value in this Area
Purchase History
We collect this data history from publicly available records. To have your information removed, we recommend requesting removal directly through your county’s website.
| Date | Buyer | Sale Price | Title Company |
|---|---|---|---|
| -- | -- | ||
| -- | -- | ||
| -- | -- | ||
| -- | -- | ||
| $15,000 | -- | ||
| -- | -- | ||
| -- | -- |
Tax History
We collect this data history from publicly available records. To have your information removed, we recommend requesting removal directly through your county’s website.
| Year | Tax Paid | Tax Assessment Tax Assessment Total Assessment is a certain percentage of the fair market value that is determined by local assessors to be the total taxable value of land and additions on the property. | Land | Improvement |
|---|---|---|---|---|
| 2025 | $716 | $30,538 | $19,000 | $11,538 |
| 2024 | $641 | $30,538 | $19,000 | $11,538 |
| 2023 | $582 | $16,550 | $8,000 | $8,550 |
| 2022 | $559 | $16,550 | $8,000 | $8,550 |
| 2021 | $511 | $16,550 | $8,000 | $8,550 |
| 2020 | $464 | $8,460 | $2,400 | $6,060 |
| 2019 | $464 | $8,460 | $2,400 | $6,060 |
| 2018 | $464 | $8,460 | $2,400 | $6,060 |
| 2017 | $439 | $8,460 | $2,400 | $6,060 |
| 2016 | $439 | $8,460 | $2,400 | $6,060 |
| 2015 | $506 | $9,560 | $2,600 | $6,960 |
| 2014 | $506 | $9,560 | $2,600 | $6,960 |
Map
- 429 E Mulberry St
- 1013 S 1st St
- 217 W Birch St
- 1203 S 3rd St
- Lot 7 S 3rd St
- Lot 5 S 3rd St
- Lot 6 S 3rd St
- 1016 S 4th St
- 121 E Veterans Pkwy
- 1219 S 5th St
- 710 S 6th St
- Lot N/2 Blk 6-10/1 Roberts & Musteen Add
- 1.47 Acres E Allen St
- 525 S 6th St
- 0 E Spring St
- 702 E Sumac St
- 1434 S Monte Northeast Rd
- 501 S 7th St
- 1530 Monte Ne Rd
- 1706 S F St
Ask me questions while you tour the home.