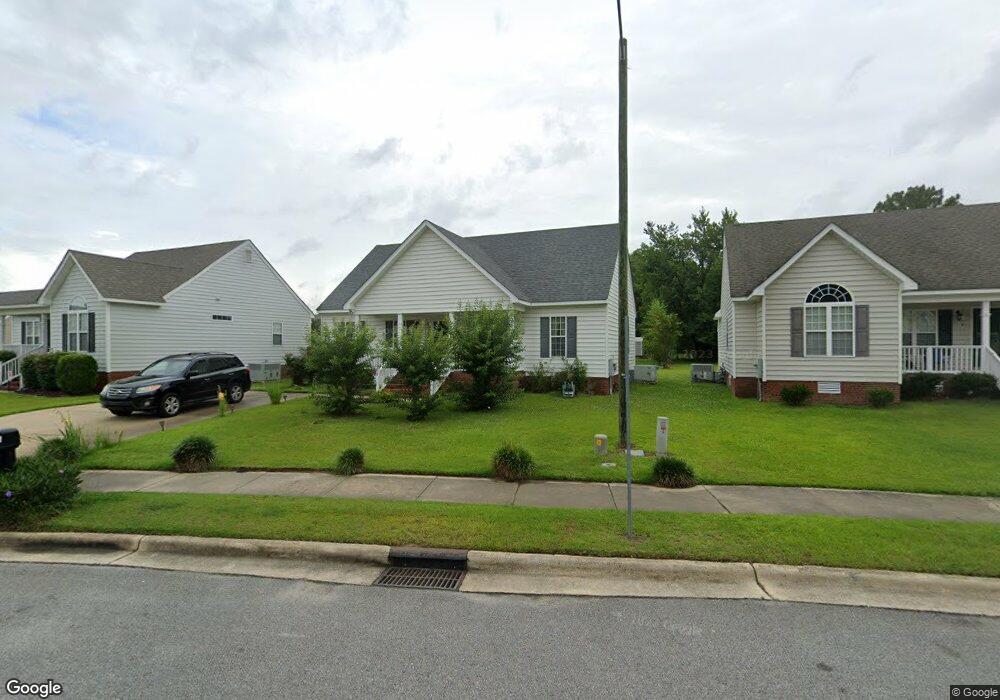
912 Sebring Dr Winterville, NC 28590
Estimated Value: $244,000 - $254,000
3
Beds
2
Baths
1,316
Sq Ft
$188/Sq Ft
Est. Value
About This Home
This home is located at 912 Sebring Dr, Winterville, NC 28590 and is currently estimated at $247,419, approximately $188 per square foot. 912 Sebring Dr is a home located in Pitt County with nearby schools including Creekside Elementary School, A.G. Cox Middle School, and South Central High School.
Ownership History
Date
Name
Owned For
Owner Type
Purchase Details
Closed on
Nov 27, 2007
Sold by
Lee Jason R and Lee Shandi M
Bought by
Smallwood Arthur C and Smallwood Laura
Current Estimated Value
Home Financials for this Owner
Home Financials are based on the most recent Mortgage that was taken out on this home.
Original Mortgage
$105,000
Outstanding Balance
$66,185
Interest Rate
6.22%
Mortgage Type
New Conventional
Estimated Equity
$181,234
Purchase Details
Closed on
Jul 28, 2006
Sold by
Kingsmill Homes Llc
Bought by
Lee Jason R and Lee Shandi M
Home Financials for this Owner
Home Financials are based on the most recent Mortgage that was taken out on this home.
Original Mortgage
$107,100
Interest Rate
6.6%
Mortgage Type
New Conventional
Create a Home Valuation Report for This Property
The Home Valuation Report is an in-depth analysis detailing your home's value as well as a comparison with similar homes in the area
Home Values in the Area
Average Home Value in this Area
Purchase History
| Date | Buyer | Sale Price | Title Company |
|---|---|---|---|
| Smallwood Arthur C | $130,000 | None Available | |
| Lee Jason R | $134,000 | None Available |
Source: Public Records
Mortgage History
| Date | Status | Borrower | Loan Amount |
|---|---|---|---|
| Open | Smallwood Arthur C | $105,000 | |
| Previous Owner | Lee Jason R | $107,100 | |
| Previous Owner | Lee Jason R | $26,780 |
Source: Public Records
Tax History Compared to Growth
Tax History
| Year | Tax Paid | Tax Assessment Tax Assessment Total Assessment is a certain percentage of the fair market value that is determined by local assessors to be the total taxable value of land and additions on the property. | Land | Improvement |
|---|---|---|---|---|
| 2025 | $2,296 | $223,804 | $35,000 | $188,804 |
| 2024 | $2,284 | $223,804 | $35,000 | $188,804 |
| 2023 | $1,811 | $145,753 | $28,000 | $117,753 |
| 2022 | $1,831 | $145,753 | $28,000 | $117,753 |
| 2021 | $1,811 | $145,753 | $28,000 | $117,753 |
| 2020 | $1,826 | $145,753 | $28,000 | $117,753 |
| 2019 | $1,618 | $123,432 | $26,500 | $96,932 |
| 2018 | $1,572 | $123,432 | $26,500 | $96,932 |
| 2017 | $1,572 | $123,432 | $26,500 | $96,932 |
| 2016 | $1,615 | $123,432 | $26,500 | $96,932 |
| 2015 | $1,615 | $128,665 | $26,500 | $102,165 |
| 2014 | $1,615 | $128,665 | $26,500 | $102,165 |
Source: Public Records
Map
Nearby Homes
- 1113 Sebring Dr
- 1124 Sebring Dr
- 2313 Saddleback Dr Unit B
- 2104 Rhinestone Dr
- 2201 Rhinestone Dr
- 913 Dearborn Ct
- 2201 Zircon Dr
- 1229 Ashmoor Ln
- 1205 Hunley Ct
- 1208 Hunley Ct
- Turner Plan at Davenport Farms
- Jordan Plan at Davenport Farms
- Sumner Plan at Davenport Farms
- Bradley Plan at Davenport Farms
- Rockbridge Plan at Davenport Farms
- Dakota Plan at Davenport Farms
- Dunley Plan at Davenport Farms
- Ivy Plan at Davenport Farms
- Westbrook Plan at Davenport Farms
- Emily Plan at Davenport Farms
- 916 Sebring Dr
- 908 Sebring Dr
- 2301 Seagrave Dr
- 904 Sebring Dr
- 2205 Seagrave Dr
- 909 Sebring Dr
- 917 Sebring Dr
- 901 Selwood Ln
- 3608 Shallowford Ct
- 939 Davenport
- 939 Davenport Farm Rd
- 1000 Sebring Dr
- 2201 Seagrave Dr
- 3604 Shallowford Ct
- 921 Sebring Dr
- 905 Selwood Ln
- 901 Sebring Dr
- 900 Selwood Ln
- 1001 Sebring Dr
- 1004 Sebring Dr