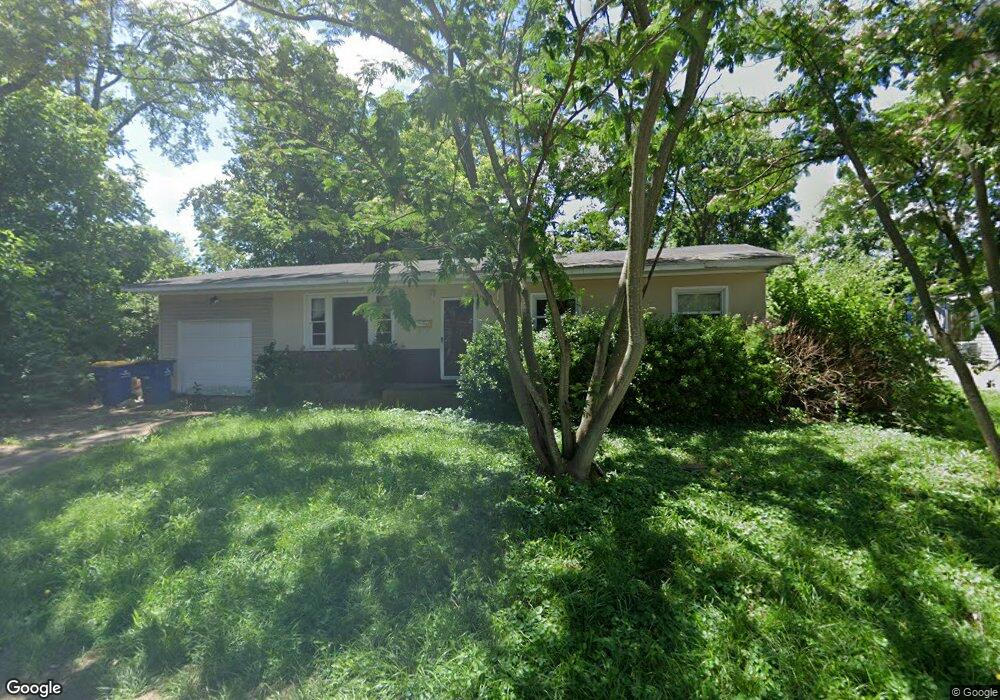
912 Terrace Dr Festus, MO 63028
Festus/Crystal City NeighborhoodEstimated Value: $148,639 - $180,000
Studio
--
Bath
1,040
Sq Ft
$159/Sq Ft
Est. Value
About This Home
This home is located at 912 Terrace Dr, Festus, MO 63028 and is currently estimated at $165,410, approximately $159 per square foot. 912 Terrace Dr is a home located in Jefferson County with nearby schools including Festus Elementary School, Festus Intermediate School, and Festus Middle School.
Ownership History
Date
Name
Owned For
Owner Type
Purchase Details
Closed on
Oct 17, 2001
Sold by
Williams Lyle D and Williams Gloria J
Bought by
Huber Mark D and Huber Courtney B
Current Estimated Value
Home Financials for this Owner
Home Financials are based on the most recent Mortgage that was taken out on this home.
Original Mortgage
$52,500
Interest Rate
6.59%
Mortgage Type
Seller Take Back
Purchase Details
Closed on
May 1, 1998
Sold by
Williams Lyle D and Williams Gloria J
Bought by
Huber Mark and Huber Courtney
Create a Home Valuation Report for This Property
The Home Valuation Report is an in-depth analysis detailing your home's value as well as a comparison with similar homes in the area
Home Values in the Area
Average Home Value in this Area
Purchase History
| Date | Buyer | Sale Price | Title Company |
|---|---|---|---|
| Huber Mark D | $55,000 | -- | |
| Huber Mark | -- | -- |
Source: Public Records
Mortgage History
| Date | Status | Borrower | Loan Amount |
|---|---|---|---|
| Previous Owner | Huber Mark D | $52,500 |
Source: Public Records
Tax History
| Year | Tax Paid | Tax Assessment Tax Assessment Total Assessment is a certain percentage of the fair market value that is determined by local assessors to be the total taxable value of land and additions on the property. | Land | Improvement |
|---|---|---|---|---|
| 2025 | $691 | $13,400 | $1,500 | $11,900 |
| 2024 | $691 | $12,200 | $1,500 | $10,700 |
| 2023 | $691 | $12,200 | $1,500 | $10,700 |
| 2022 | $687 | $12,200 | $1,500 | $10,700 |
| 2021 | $688 | $12,200 | $1,500 | $10,700 |
| 2020 | $643 | $10,700 | $1,200 | $9,500 |
| 2019 | $643 | $10,700 | $1,200 | $9,500 |
| 2018 | $580 | $10,700 | $1,200 | $9,500 |
| 2017 | $580 | $10,700 | $1,200 | $9,500 |
| 2016 | $528 | $9,700 | $1,300 | $8,400 |
Source: Public Records
Map
Nearby Homes
- 609 Valentine St
- 416 Russell Ave
- 617 N 6th St
- 806 Virginia Ave
- 810 S 2nd St
- 912 Parc Central Dr
- 716 N Mill St
- 1001 Parc Central Dr
- 601 Warne St
- 17 Ash Ct
- 202 Sunshine Dr
- 510 Rose Ln
- 1018 Savanna Place Dr
- 410 S 4th St
- 518 Westwood Place
- 1113 Huber St
- 409 S 5th St
- 405 S 5th St
- 707 Jerome Dr
- 621 Westwood Dr S Unit A
Your Personal Tour Guide
Ask me questions while you tour the home.