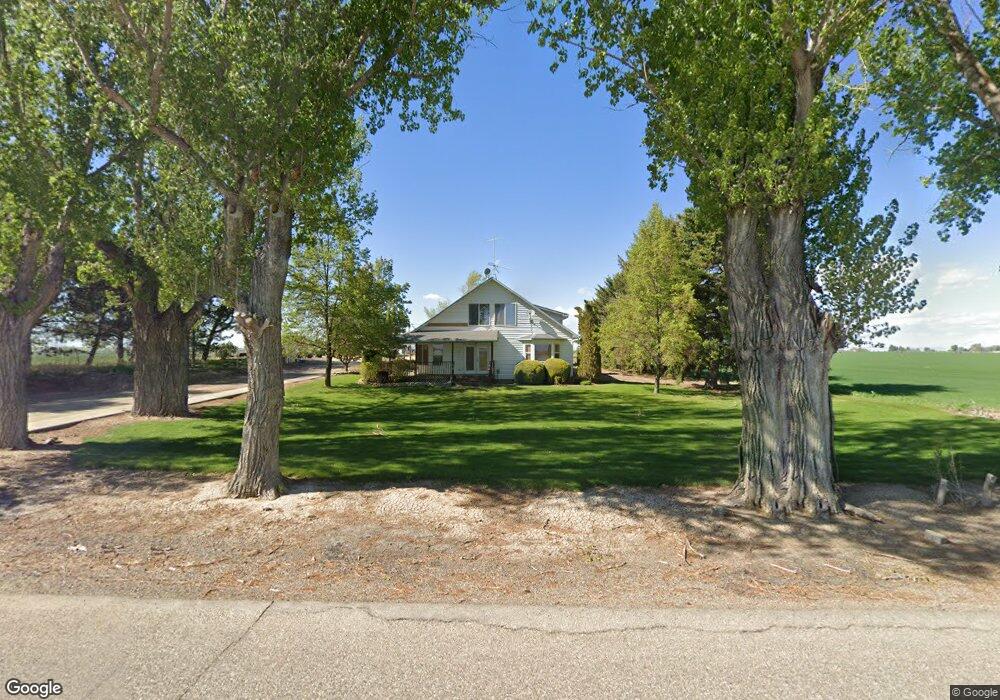
912 W 300 S Heyburn, ID 83336
Estimated Value: $401,000 - $564,000
4
Beds
2
Baths
2,438
Sq Ft
$194/Sq Ft
Est. Value
About This Home
This home is located at 912 W 300 S, Heyburn, ID 83336 and is currently estimated at $472,201, approximately $193 per square foot. 912 W 300 S is a home located in Minidoka County with nearby schools including Paul Elementary School and Minico Senior High School.
Ownership History
Date
Name
Owned For
Owner Type
Purchase Details
Closed on
Nov 7, 2019
Sold by
Ball Kara and Schmidt Kara
Bought by
Schmidt David M
Current Estimated Value
Home Financials for this Owner
Home Financials are based on the most recent Mortgage that was taken out on this home.
Original Mortgage
$157,000
Interest Rate
3.65%
Mortgage Type
New Conventional
Purchase Details
Closed on
May 26, 2009
Sold by
Mangum Duane J and Mangum Gaye J
Bought by
Schmidt David and Schmidt Kara
Home Financials for this Owner
Home Financials are based on the most recent Mortgage that was taken out on this home.
Original Mortgage
$190,230
Interest Rate
4.76%
Mortgage Type
New Conventional
Purchase Details
Closed on
Aug 24, 2007
Sold by
Kniep Gary A and Kniep Deborah L
Bought by
Mangum Duane J and Mangum Gaye J
Home Financials for this Owner
Home Financials are based on the most recent Mortgage that was taken out on this home.
Original Mortgage
$180,000
Interest Rate
6.25%
Mortgage Type
Adjustable Rate Mortgage/ARM
Create a Home Valuation Report for This Property
The Home Valuation Report is an in-depth analysis detailing your home's value as well as a comparison with similar homes in the area
Home Values in the Area
Average Home Value in this Area
Purchase History
| Date | Buyer | Sale Price | Title Company |
|---|---|---|---|
| Schmidt David M | -- | First American Title Burley | |
| Schmidt David | -- | -- | |
| Mangum Duane J | -- | -- |
Source: Public Records
Mortgage History
| Date | Status | Borrower | Loan Amount |
|---|---|---|---|
| Closed | Schmidt David M | $157,000 | |
| Closed | Schmidt David | $190,230 | |
| Previous Owner | Mangum Duane J | $180,000 |
Source: Public Records
Tax History Compared to Growth
Tax History
| Year | Tax Paid | Tax Assessment Tax Assessment Total Assessment is a certain percentage of the fair market value that is determined by local assessors to be the total taxable value of land and additions on the property. | Land | Improvement |
|---|---|---|---|---|
| 2025 | $1,618 | $423,310 | $67,380 | $355,930 |
| 2024 | $1,618 | $423,310 | $67,380 | $355,930 |
| 2023 | $1,299 | $402,160 | $67,380 | $334,780 |
| 2022 | $1,542 | $352,162 | $52,152 | $300,010 |
| 2021 | $1,250 | $274,302 | $44,652 | $229,650 |
| 2020 | $1,269 | $247,132 | $40,152 | $206,980 |
| 2019 | $1,251 | $233,436 | $0 | $0 |
| 2018 | $1,015 | $202,268 | $33,788 | $168,480 |
| 2017 | $997 | $203,484 | $25,384 | $178,100 |
| 2016 | $1,007 | $94,745 | $0 | $0 |
| 2015 | -- | $0 | $0 | $0 |
| 2014 | -- | $0 | $0 | $0 |
| 2012 | -- | $0 | $0 | $0 |
Source: Public Records
Map
Nearby Homes