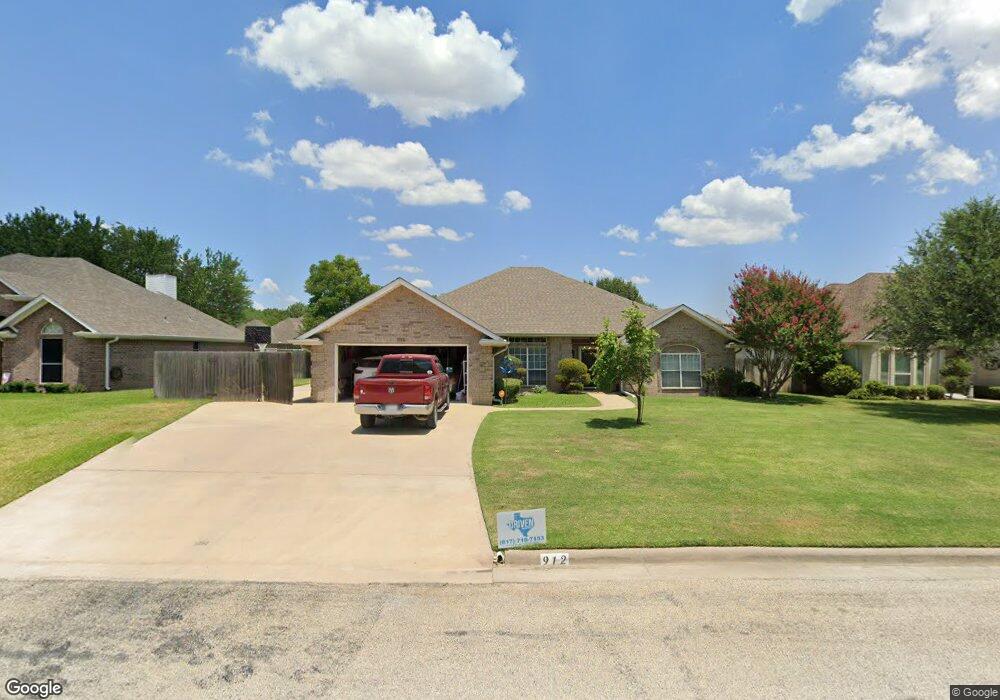
912 Wheeler Creek Dr Gainesville, TX 76240
Estimated Value: $352,578 - $531,000
4
Beds
2
Baths
2,428
Sq Ft
$173/Sq Ft
Est. Value
About This Home
This home is located at 912 Wheeler Creek Dr, Gainesville, TX 76240 and is currently estimated at $420,895, approximately $173 per square foot. 912 Wheeler Creek Dr is a home located in Cooke County with nearby schools including Edison Elementary School, W.E. Chalmers Elementary School, and Gainesville Intermediate School.
Ownership History
Date
Name
Owned For
Owner Type
Purchase Details
Closed on
Nov 20, 2019
Sold by
Burkhart William Michael and Burkhart Daloris Ann
Bought by
Burkhart William Michael and Burkhart Daloris Ann
Current Estimated Value
Purchase Details
Closed on
Jan 1, 2017
Sold by
Burkhart Darleen
Bought by
Burkhart Mike and Burkhart Daloris
Purchase Details
Closed on
Oct 28, 2016
Sold by
Gibson Danny and Gibson Rachelle
Bought by
Burkhart Darleen
Purchase Details
Closed on
May 1, 2015
Sold by
Chase Sherry E and Burrus James L
Bought by
Gibson Danny
Home Financials for this Owner
Home Financials are based on the most recent Mortgage that was taken out on this home.
Original Mortgage
$231,632
Interest Rate
3.74%
Mortgage Type
New Conventional
Purchase Details
Closed on
Apr 12, 2012
Sold by
Burrus Mella Jean
Bought by
Chase Sherry E and Burrus James L
Create a Home Valuation Report for This Property
The Home Valuation Report is an in-depth analysis detailing your home's value as well as a comparison with similar homes in the area
Home Values in the Area
Average Home Value in this Area
Purchase History
| Date | Buyer | Sale Price | Title Company |
|---|---|---|---|
| Burkhart William Michael | -- | None Available | |
| Burkhart Mike | -- | None Available | |
| Burkhart Darleen | -- | Howeth Title Company | |
| Gibson Danny | -- | None Available | |
| Chase Sherry E | -- | None Available |
Source: Public Records
Mortgage History
| Date | Status | Borrower | Loan Amount |
|---|---|---|---|
| Previous Owner | Gibson Danny | $231,632 |
Source: Public Records
Tax History Compared to Growth
Tax History
| Year | Tax Paid | Tax Assessment Tax Assessment Total Assessment is a certain percentage of the fair market value that is determined by local assessors to be the total taxable value of land and additions on the property. | Land | Improvement |
|---|---|---|---|---|
| 2025 | $3,719 | $392,991 | $55,000 | $337,991 |
| 2024 | $3,719 | $392,991 | $55,000 | $337,991 |
| 2023 | $6,630 | $337,918 | $55,000 | $332,226 |
| 2022 | $6,688 | $363,369 | $44,200 | $319,169 |
| 2021 | $7,191 | $279,271 | $26,000 | $253,271 |
| 2020 | $7,185 | $270,562 | $26,000 | $244,562 |
| 2019 | $7,028 | $257,156 | $22,000 | $235,156 |
| 2018 | $6,431 | $235,673 | $22,000 | $213,673 |
| 2017 | $6,140 | $225,849 | $22,000 | $203,849 |
| 2015 | -- | $203,220 | $20,000 | $183,220 |
| 2014 | -- | $201,304 | $20,000 | $181,304 |
Source: Public Records
Map
Nearby Homes
- 1010 Aspen Rd
- 904 Wheeler Creek Dr
- 2002 Everglade Dr
- 1112 Hillside Dr
- 1907 Woodlawn Ct
- 00 O'Neal St
- 1212 Aspen Rd
- 1109 Elmwood St
- 2005 Maplewood Dr
- 2003 Cypress St
- 417 Willow Way
- 1102 Fair Ave
- 418 Hillside Dr
- 1113 Fair Ave
- 1520 Olive St
- 1016 N Howeth St
- 705 Fair Ave
- 311 Wheeler Creek Ct
- 1305 Hillcrest Blvd
- 1306 N Clements St
- 914 Wheeler Creek Dr
- 910 Wheeler Creek Dr
- 913 Mesquite St
- 915 Mesquite St
- 911 Mesquite St
- 908 Wheeler Creek Dr
- 2200 Mesquite St
- 911 Wheeler Creek Dr
- 909 Mesquite St
- 2105 Wheeler Creek Cir
- 906 Wheeler Creek Dr
- 913 Wheeler Creek Dr
- 915 Wheeler Creek Dr
- 907 Mesquite St
- 1001 Wheeler Creek Dr
- 2103 Wheeler Creek Cir
- 912 Mesquite St
- 910 Mesquite St
- 1003 Wheeler Creek Dr
- 2209 Mesquite St