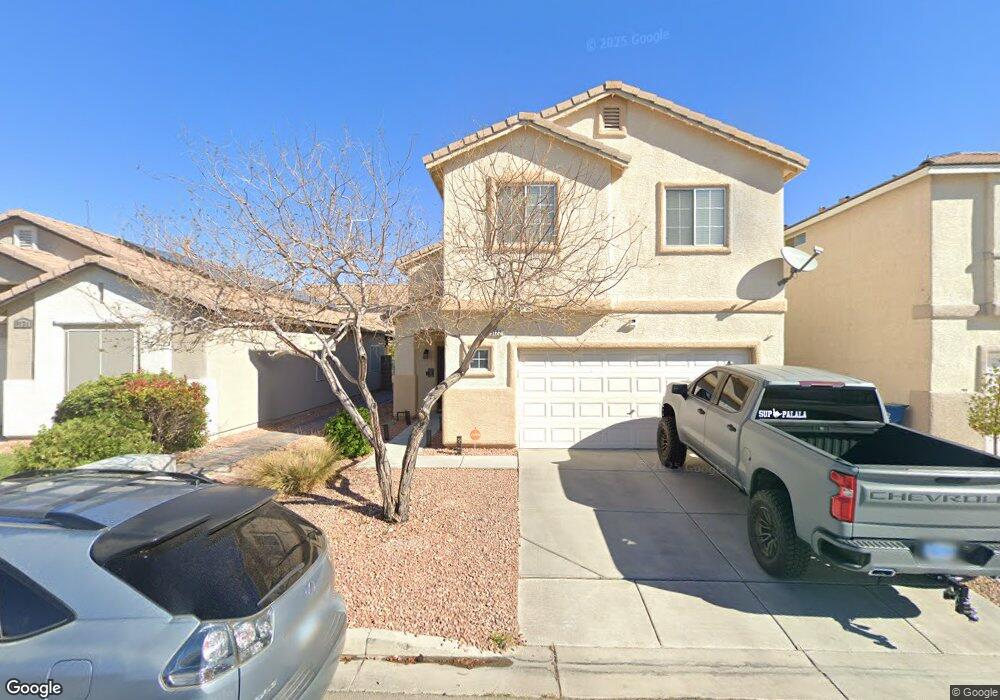
9120 Black Maple Ave Las Vegas, NV 89148
Estimated Value: $460,000 - $487,000
3
Beds
3
Baths
1,897
Sq Ft
$249/Sq Ft
Est. Value
About This Home
This home is located at 9120 Black Maple Ave, Las Vegas, NV 89148 and is currently estimated at $471,562, approximately $248 per square foot. 9120 Black Maple Ave is a home located in Clark County with nearby schools including Wayne N. Tanaka Elementary School, Wilbur & Theresa Faiss Middle School, and Sierra Vista High School.
Ownership History
Date
Name
Owned For
Owner Type
Purchase Details
Closed on
Feb 23, 2009
Sold by
Bank Of America National Association
Bought by
Derstin Baruch and Derstin Ester
Current Estimated Value
Purchase Details
Closed on
Oct 22, 2008
Sold by
Markey Cris
Bought by
Lasalle Bank Na
Purchase Details
Closed on
Jan 12, 2006
Sold by
Lee Carl M
Bought by
Markey Cris
Home Financials for this Owner
Home Financials are based on the most recent Mortgage that was taken out on this home.
Original Mortgage
$295,920
Interest Rate
2.5%
Mortgage Type
Negative Amortization
Purchase Details
Closed on
Aug 24, 2004
Sold by
Pinnacle Maplewood
Bought by
Lee Carl M
Home Financials for this Owner
Home Financials are based on the most recent Mortgage that was taken out on this home.
Original Mortgage
$248,792
Interest Rate
4.25%
Mortgage Type
Credit Line Revolving
Create a Home Valuation Report for This Property
The Home Valuation Report is an in-depth analysis detailing your home's value as well as a comparison with similar homes in the area
Home Values in the Area
Average Home Value in this Area
Purchase History
| Date | Buyer | Sale Price | Title Company |
|---|---|---|---|
| Derstin Baruch | $152,500 | Lawyers Title Of Nevada West | |
| Lasalle Bank Na | $180,000 | Fidelity National | |
| Markey Cris | $369,900 | Fidelity National Title | |
| Lee Carl M | $310,990 | Equity Title Of Nevada |
Source: Public Records
Mortgage History
| Date | Status | Borrower | Loan Amount |
|---|---|---|---|
| Previous Owner | Markey Cris | $295,920 | |
| Previous Owner | Lee Carl M | $248,792 | |
| Closed | Lee Carl M | $62,198 |
Source: Public Records
Tax History Compared to Growth
Tax History
| Year | Tax Paid | Tax Assessment Tax Assessment Total Assessment is a certain percentage of the fair market value that is determined by local assessors to be the total taxable value of land and additions on the property. | Land | Improvement |
|---|---|---|---|---|
| 2025 | $1,942 | $120,036 | $38,500 | $81,536 |
| 2024 | $1,886 | $120,036 | $38,500 | $81,536 |
| 2023 | $1,886 | $110,307 | $33,250 | $77,057 |
| 2022 | $1,539 | $98,398 | $28,000 | $70,398 |
| 2021 | $1,778 | $91,498 | $24,500 | $66,998 |
| 2020 | $1,723 | $91,362 | $25,200 | $66,162 |
| 2019 | $1,673 | $84,164 | $19,250 | $64,914 |
| 2018 | $1,624 | $80,502 | $18,200 | $62,302 |
| 2017 | $2,335 | $79,615 | $16,450 | $63,165 |
| 2016 | $1,539 | $70,551 | $11,900 | $58,651 |
| 2015 | $1,535 | $60,315 | $10,850 | $49,465 |
| 2014 | $1,487 | $49,201 | $7,000 | $42,201 |
Source: Public Records
Map
Nearby Homes
- 9186 Berstler Ave Unit 1A
- 6884 Stonetrace St
- 9086 Nostrand Ave
- 9163 Vesey Ave
- 6679 Gentle Cloud Ct
- 9213 Broome Ct
- 9219 Broome Ct
- 9113 Rivington Ave
- 9125 Rivington Ave
- 9225 Broome Ct
- 9137 Rivington Ave
- 8970 Drew Valley Ct
- 8940 Sky Lux Place
- 9136 Rivington Ave
- 9142 Rivington Ave
- 6788 Rose Mallow St Unit 3
- 6670 Tumoulin St
- 9178 Rivington Ave
- 6768 Pastel Camellia St
- 9184 Rivington Ave
- 9126 Black Maple Ave
- 9126 Black Maple Ave Unit na
- 9132 Black Maple Ave
- 9121 Mountain Maple Ct
- 9127 Mountain Maple Ct
- 6782 Canyon Maple St
- 6792 Canyon Maple St
- 9133 Mountain Maple Ct
- 9138 Black Maple Ave
- 9119 Black Maple Ave
- 6772 Canyon Maple St
- 9125 Black Maple Ave
- 9111 Black Maple Ave
- 9131 Black Maple Ave
- 6762 Canyon Maple St
- 9139 Mountain Maple Ct
- 9107 Black Maple Ave Unit none
- 9107 Black Maple Ave
- 9144 Black Maple Ave
- 9101 Black Maple Ave