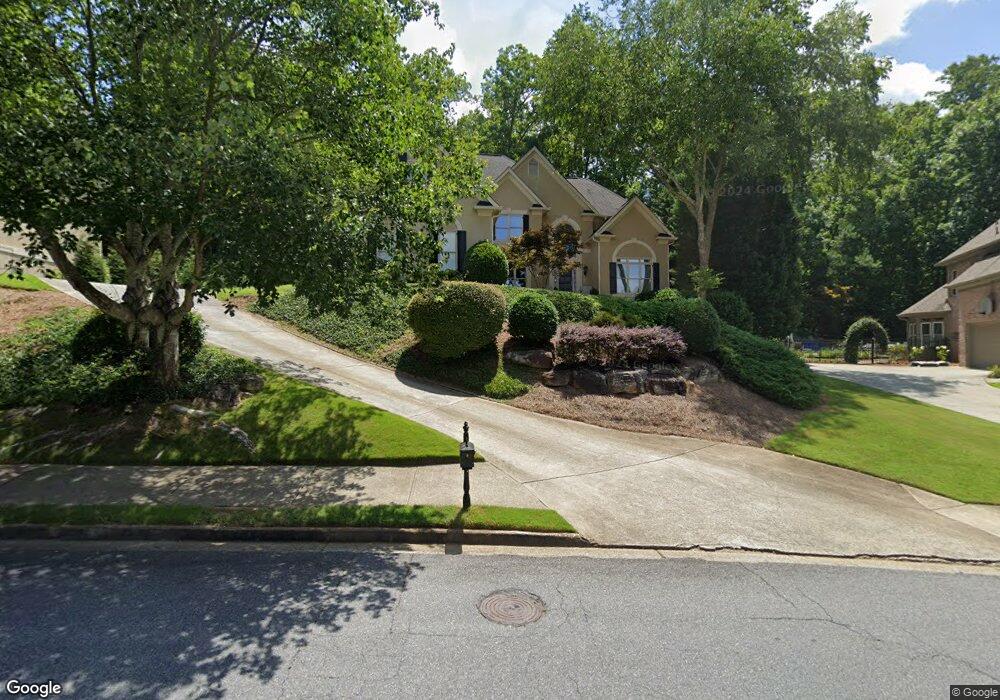
9120 Nesbit Lakes Dr Unit 6 Alpharetta, GA 30022
Nesbit Lakes NeighborhoodEstimated Value: $971,325 - $1,083,000
4
Beds
4
Baths
3,876
Sq Ft
$267/Sq Ft
Est. Value
About This Home
This home is located at 9120 Nesbit Lakes Dr Unit 6, Alpharetta, GA 30022 and is currently estimated at $1,035,581, approximately $267 per square foot. 9120 Nesbit Lakes Dr Unit 6 is a home located in Fulton County with nearby schools including Hillside Elementary School, Haynes Bridge Middle School, and Centennial High School.
Ownership History
Date
Name
Owned For
Owner Type
Purchase Details
Closed on
Dec 17, 2002
Sold by
Gurry Edward A and Gurry Virginia B
Bought by
Farrell James E and Farrell Cindy V
Current Estimated Value
Home Financials for this Owner
Home Financials are based on the most recent Mortgage that was taken out on this home.
Original Mortgage
$359,200
Outstanding Balance
$149,931
Interest Rate
4.75%
Mortgage Type
New Conventional
Estimated Equity
$885,650
Purchase Details
Closed on
Aug 12, 1998
Sold by
Forrest Gary E and Forrest Sue Ann
Bought by
Gurry Edward A and Gurry Virginia
Home Financials for this Owner
Home Financials are based on the most recent Mortgage that was taken out on this home.
Original Mortgage
$339,200
Interest Rate
6.91%
Mortgage Type
New Conventional
Purchase Details
Closed on
Feb 3, 1994
Sold by
Robertson D C Inc
Bought by
Forret Gary E Sue A
Home Financials for this Owner
Home Financials are based on the most recent Mortgage that was taken out on this home.
Original Mortgage
$203,150
Interest Rate
6.96%
Create a Home Valuation Report for This Property
The Home Valuation Report is an in-depth analysis detailing your home's value as well as a comparison with similar homes in the area
Home Values in the Area
Average Home Value in this Area
Purchase History
| Date | Buyer | Sale Price | Title Company |
|---|---|---|---|
| Farrell James E | $449,900 | -- | |
| Gurry Edward A | -- | -- | |
| Forret Gary E Sue A | $370,700 | -- |
Source: Public Records
Mortgage History
| Date | Status | Borrower | Loan Amount |
|---|---|---|---|
| Open | Farrell James E | $359,200 | |
| Previous Owner | Gurry Edward A | $339,200 | |
| Previous Owner | Forret Gary E Sue A | $203,150 |
Source: Public Records
Tax History Compared to Growth
Tax History
| Year | Tax Paid | Tax Assessment Tax Assessment Total Assessment is a certain percentage of the fair market value that is determined by local assessors to be the total taxable value of land and additions on the property. | Land | Improvement |
|---|---|---|---|---|
| 2025 | $1,281 | $304,560 | $79,320 | $225,240 |
| 2023 | $7,983 | $282,840 | $57,000 | $225,840 |
| 2022 | $6,238 | $276,600 | $45,840 | $230,760 |
| 2021 | $7,214 | $258,240 | $36,800 | $221,440 |
| 2020 | $7,212 | $243,600 | $44,120 | $199,480 |
| 2019 | $1,093 | $225,040 | $47,640 | $177,400 |
| 2018 | $5,861 | $219,760 | $46,520 | $173,240 |
| 2017 | $5,817 | $211,320 | $44,720 | $166,600 |
| 2016 | $5,926 | $215,080 | $44,720 | $170,360 |
| 2015 | $6,202 | $234,800 | $44,720 | $190,080 |
| 2014 | $5,389 | $188,560 | $26,160 | $162,400 |
Source: Public Records
Map
Nearby Homes
- 940 Waters Reach Ct
- 9195 Nesbit Lakes Dr
- 920 Waters Reach Ct
- 245 Spring Ridge Trace
- 1020 Summer Oaks Close Unit 4
- 2765 Chandon Place
- 1250 Atherton Park
- 260 Spring Ridge Dr
- 205 Nesbit Entry Dr
- 585 Saint Regis Ln
- 2642 Long Pointe
- 590 Ridgemont Dr
- 109 W Ridge Way
- 160 Arden Place
- 4040 Declaration Dr
- 280 Vidaulan Ct
- 1035 Penny Ln
- 970 Laurel Mill Dr
- 9130 Nesbit Lakes Dr
- 9110 Nesbit Lakes Dr
- 4040 Briarstone Ridge Trace
- 9125 Nesbit Lakes Dr
- 4045 Briarstone Ridge Trace
- 9100 Nesbit Lakes Dr Unit 6
- 4030 Briarstone Ridge Trace
- 9090 Nesbit Lakes Dr Unit 6
- 4020 Briarstone Ridge Trace
- 4035 Briarstone Ridge Trace
- 4025 Briarstone Ridge Way
- 9080 Nesbit Lakes Dr
- 9140 Nesbit Lakes Dr Unit 6
- 4025 Briarstone Ridge Trc
- 4025 Briarstone Ridge Trace
- 4015 Briarstone Ridge Trace
- 4010 Briarstone Ridge Trace
- 9095 Nesbit Lakes Dr
- 9145 Nesbit Lakes Dr Unit 6
- 0 Briarstone Ridge Trace Unit 8718543